
TLDR Breakdown:
- BNB successfully held support at $265
- Approaching multiple resistances $290
- Could rise to $315 if it successfully breaks to the upside
Cryptocurrency Heatmap by Coin360
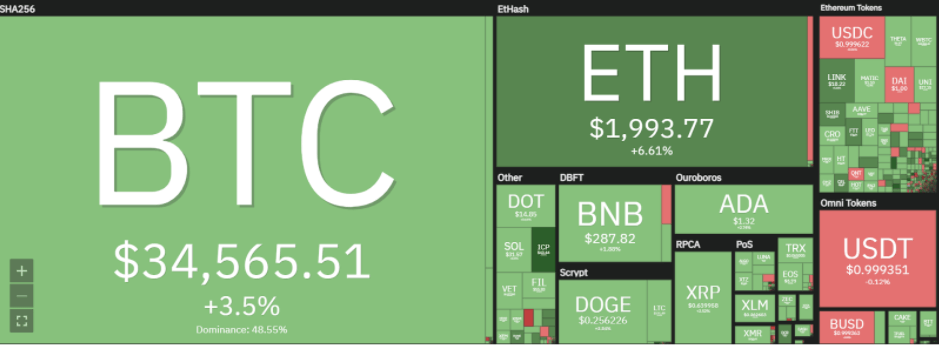
A majority of the market is now “in the green” over the last 24 hours. Whilst most of the world slept last night, Binance Coin (BNB) followed other major coins such as Bitcoin (BTC) and Ethereum (ETH) and enjoyed a sporadic rise of around 5-6% within just a few hours. However, whilst this may normally be celebrated, it does not make up for the drastic losses seen by most currencies over the last few weeks.
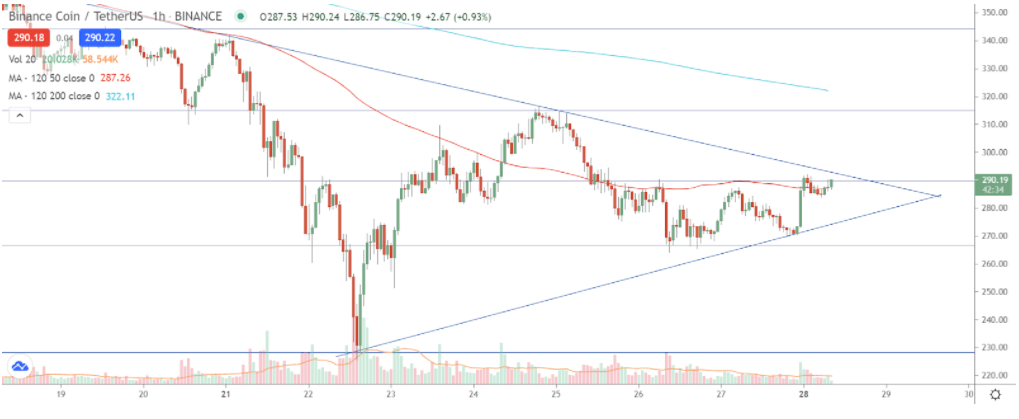
BNB price over the last 24 hours – Continues moving within a tight range.
BNB successfully managed to hold its support at $265 which has been a key area for several days. It tested the resistance at $290 a few times; with hopes to break it, but has not successfully achieved it yet. It continues to move within the tight range with increasing “pressure” being built up. It looks to be poised to have an explosive breakout, but is undecided which way it will break out. If the resistance at $290 is held, then it can be expected for price to to correct back to the downside and retest $265 again.
 BNB/USD price chart by Tradingview
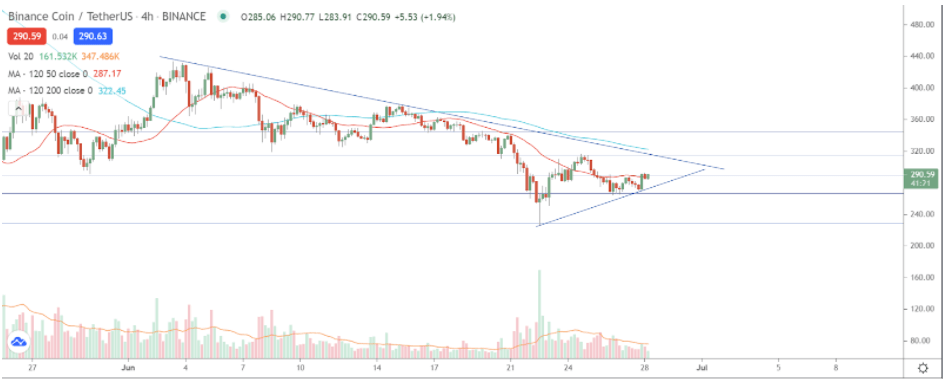
BNB/USD 4-Hour chart: Ready to breakout?
A short term bullish trend line appears to be forming which could be crucial in anticipating if BNB will break to the upside. However, it is important to know that whilst the short term trend is bullish, the longer term trend is bearish with the longer term trend line taking a higher priority. Furthermore, it is important to know that the moving averages (MA) still remain bearish with the shorter MA in red remaining below the longer MA. Since MA’s can also be used as resistance, it makes it even more crucial to note where price is currently situated. Not only is it approaching the horizontal resistance, but it is also approaching both the trend line resistance and the MA resistance. Therefore, whilst in the short term a breakout of the $290 resistance may be in play, BNB will have an extremely hard time breaking through resistance at $315.
BNB/USD price chart by Tradingview
Conclusion – BNB is poised for a move towards $315
BNB has been testing its current resistance at $290 for a few days and each time, the resistance appears to be weakening. However, it is still dependent on what BTC does, as it BTC decides to fall, BNB’s resistance will also hold and we would expect to see prices of $265 again. If this situation does not occur, then we could see BNB breaking the $290 resistance towards the upside with potential to move towards $315. For this to occur, we would expect BNB to break $290, test it as support successfully, which would then provide suitable confirmation.
For more news, guides and cryptocurrency analysis, click here.
Disclaimer: The views and opinions expressed by the author should not be considered as financial advice. We do not give advice on financial products.