
Good afternoon everyone, or morning, or evening, depending on where you are in the world, and welcome to this week’s technical analysis of the crypto markets.
We don’t beat around the bush here at Coin Rivet. We get on with things, so, without further ado, let’s start with the most important chart of the lot – Bitcoin.
Bitcoin…
I’ve stripped out all the noise from this one to focus on one thing and one thing alone. That is the enormous triangular pattern that bitcoin has been forming over many months during this period of consolidation/bear market – whatever you want to call it.
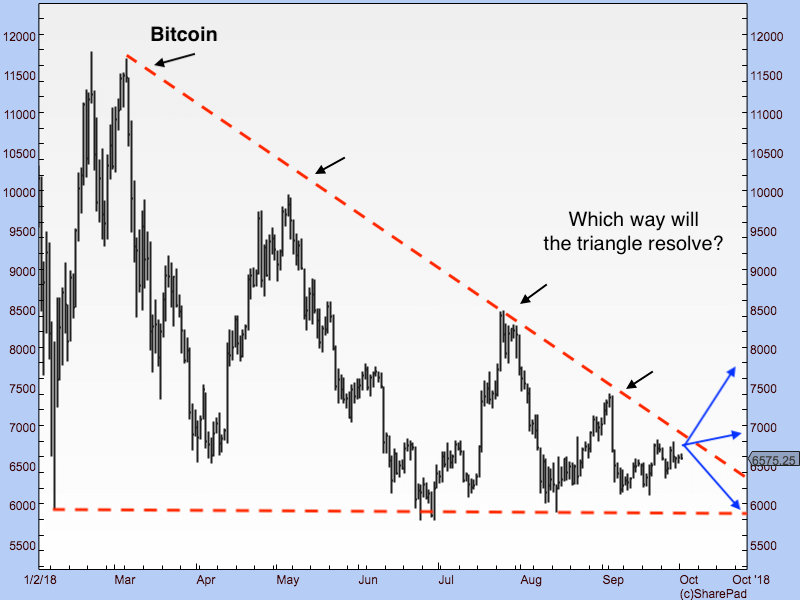
I’ve outlined the triangle with the red dashed line. You can see the huge support there is for Bitcoin in the $5,800 to $6,000 area (horizontal red line), yet the sequence of lower lows (black arrows), which Bitcoin has been following.
The range is getting narrower and narrower. It will not be long until it resolves.
Bulls want to see $5,800 continuing to hold on any sell-off and they want to see Bitcoin breaking above the descending red line on rallies. Bears want to see $5,800 failing. If it fails, by the way, there could be an avalanche as I imagine a plethora of people have got their stops not far under that line.
These periods of consolidation tend to be all about frustrating as many people as possible, so it would not surprise me to see false breaks galore, but ultimately sideways action, because that’s what so often seems to happen.
Ethereum…
Next we come to Ethereum.
Ethereum has traced out a classic “falling wedge” pattern, as outlined by the black lines in the chart below.
A break-out from a falling wedge is supposed to be a bullish sign – and that is what ethereum has done, albeit rather limply. I must say, I am deeply suspicious about falling wedges. They don’t seem to work as often as they do, but at least they define your risk.
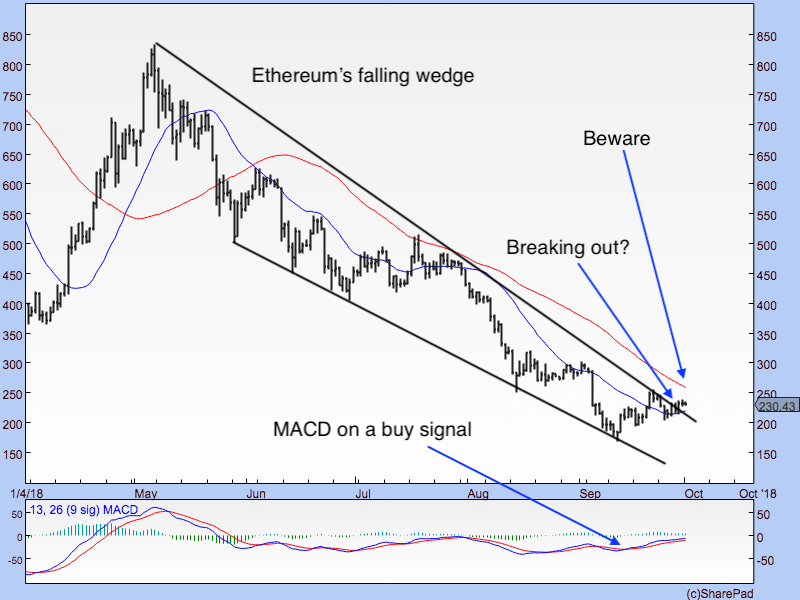
I would also draw your attention to the fact that the momentum indicator MACD is also on a buy signal. Ethereum has now climbed above its 21-day moving average (blue line) and it is sloping up. In other words, we have the makings of a trend.
However, it did just the same thing back in July and the rally ran out of steam when it reached its 55-day moving average (red line). So the question here is whether it runs out of steam again at the 55-day moving average.
I can see two potential trades here, each one contrary. One is to be long Ethereum as long as it stays above its 21-day moving average. The other is to short it when it gets to its 55-day moving average, with risk managed to just the other side.
All in all its pretty inconclusive stuff, and it feels like you’re trying to grab pennies in front of a potential steam roller. I wouldn’t speculate anything more than play money, if there is such a thing. The broader trend is down.
Ripple…
So to Ripple.
As I’ve said many times before, I don’t get Ripple. I never have. The beauty of technical analysis is that it strips out such unfounded biases, however. It’s either going up or isn’t. Ripple is going up.
Last week’s spike has provided us with a nicely defined range. We have pulled back to 45c, as predicted, and it has held, which is a good sign for the bulls.
The trend is now up and there is even a nice trend line to use, although it’s so vertical it could easily be violated.
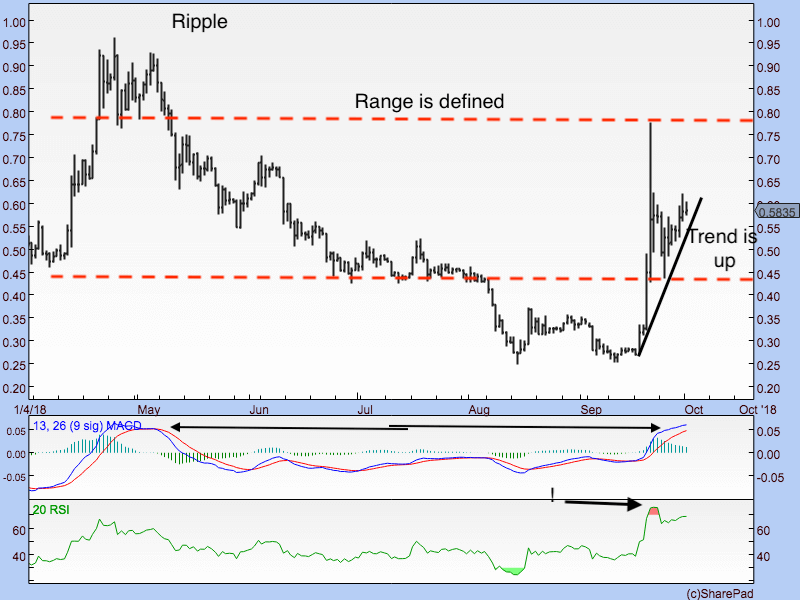
The warning signs are in the momentum indicators. MACD is up in the region it was in back in May when Ripple ran out of steam. RSI is looking pretty hot as well.
I guess a possible re-test of the upper side of the range is on the cards, if the sector as a whole holds up. Like everything else at the moment in this sector though, I wouldn’t stake my life on it.
In fact, it’s symptomatic of the whole sector: it’s got range trade written all over it.
Let’s look at Bitcoin Cash – a coin for which I have rather a fondness, rightly or wrongly.
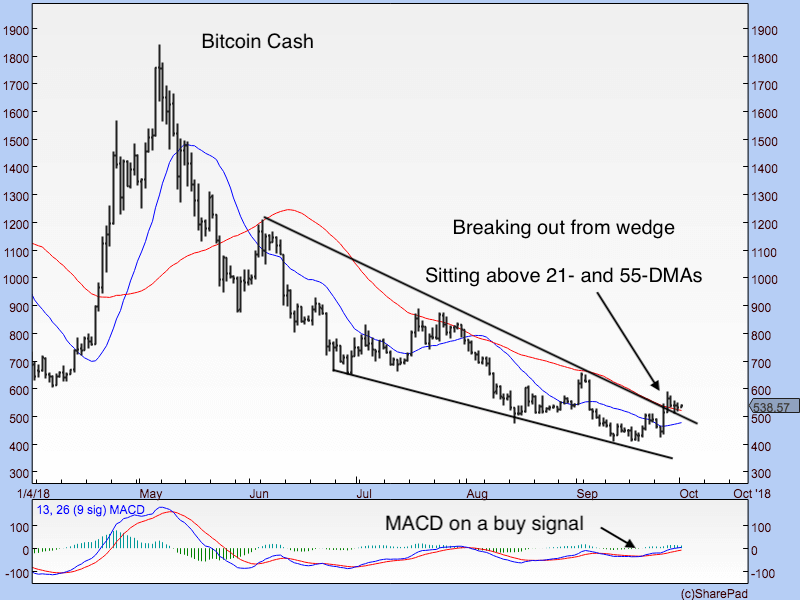
It’s a similar story to ethereum, though a slightly better one.
There’s the same falling wedge pattern. Bitcoin Cash has broken out above it, after a nice two day rally last week. In addition it is sitting above its 21- (blue line) and 55-day (red line) moving averages, which are turning up. In addition, MACD has turned up.
That, my friends, is the making of a trend. In fact, on seeing that Bitcoin Cash has broken above its 55-DMA, where it failed in July, I’m now a little more positive about Ethereum than I was a few hundred words ago.
The story is the same across the sector. The downward trend of recent months is stabilizing. Some coins are clawing back their losses, others have flattened out. That is a good sign and suggestive that this bear market is nearer its end than its beginning.
I’ve lived through many bear markets, especially in junior mining, and I know all too well how painful they can get, so you’ll be reading the commentary of someone who will remain cynical to the last. This could just be a period of stabilisation before further falls. But a few months of sideways action and even upwards bias, rather than relentless grinding lower, looks possible. Fingers crossed.
DF
Disclaimer: The views and opinions expressed by the author should not be considered as financial advice. We do not give advice on financial products.