Bitcoin and cryptocurrencies had something of a rally yesterday, rising between 5–10%.
The overall market cap of the sector now stands at $112 billion, so we are up a percent or two on last week.
In terms of market share, Bitcoin remains roughly where it was last week at 54%. Its price is just below $3,500 and its market cap is $61 billion.
The most important development from a technical point of view is that the falls have subsided, at least for now, and that the $3,000 area has held. This is another significant price point. It is one I have identified before and the bulls will want it to hold.
I want to start by showing you a chart of Bitcoin over the last 20 months. I’ve drawn a simple, red, horizontal line at the $3,000 point.
It is a basic maxim of technical analysis that what was once resistance becomes support. We can see that this was very much the case with the $3,000 level back in summer 2017. $3,000 was a barrier that Bitcoin could not get through. When it finally did, it burst up over $1,000, then came back to retest the $3,000 area. It held, and then Bitcoin was off to the races.
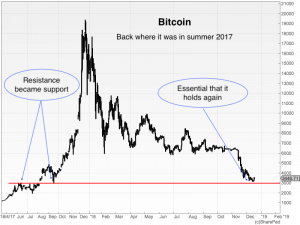
Here we are in December 2018, roughly a year on from Bitcoin’s epic, all-time high at $20,000, and we are back at that same area of support.
If it doesn’t hold, I rather suspect we might head down to the $2,000 area, or just below. I have identified this number for pretty much the same reasons that I identified $3,000. It was both support and resistance on the way up.
Here’s a log chart of Bitcoin’s ascent, with those pivotal levels identified with horizontal, red lines.
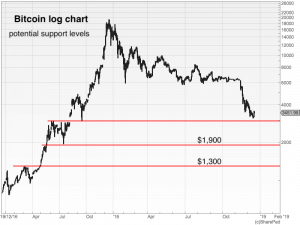
I have to say that I don’t see quite as much support just below $2,000 as I do at $3,000, but you never know. (I tend to use very round numbers with Bitcoin, by the way, because the figures vary so much from exchange to exchange.)
So, I would make the tentative prognostication that if $3,000 gives way, $2,000 is likely to as well, which would take us all the way back to the initial break-out point around $1,300, or just below. This was the 2013 high – the previous time that Bitcoin went off on one of its mega runs – and it was a huge barrier of resistance for the best part of four years, until Bitcoin finally broke through in 2017. It is the same principle at work again – what was once resistance becomes support, though on a much greater, multi-year scale.
Where Bitcoin goes, the rest will follow. At present, this is “all one market”. There are slight deviations from coin to coin, but for the large part, the sector is trading as one. We have yet to reach the point where individual, stand-out coins buck the rest of the sector and rise for significant periods of time, when all about them fall. That’s a development I will be looking for next year. It will be a sign that the bear market is over. And those coins that start bucking the trend will likely be the Amazons, Apples, and Googles of the next phase in the evolution of crypto.
If there is a coin that is bucking the action of the rest of the sector, it is, believe it or not, Ripple. I say believe it or not because Ripple, it could quite easily be argued, is not a true cryptocurrency in that it is neither mined nor decentralised. Qualities or lack thereof aside, you cannot argue with price, and Ripple has done something none of the other major coins have done, which is to hold above its September lows.
Its current price is $0.33 and its market cap is around $13.3 billion.
In the chart below, you can see that, in holding above its September lows, it has now put in something of a triple bottom, as I’ve identified in red. We now have a clear pivotal price point to play with and a low-risk trade is to long Ripple, with stops just below the September lows of $0.24/0.25.
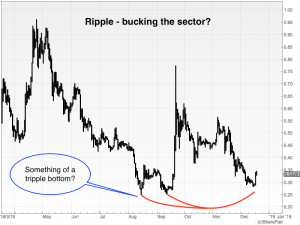
Before running out and declaring to the world that Ripple is going to be the Amazon of crypto, it is worth remembering that Ripple’s all-time high was around $3.80, back in early January. To have fallen from $3.80 to $0.24 is a drop of around 94%. This is hardly inspiring.
Of all the major coins yesterday, EOS had the strongest rally, moving up around 22%. It is now $2.40 and, at $2.2 billion, the fourth largest coin by market cap. EOS had its own sector-bucking moment earlier in the year. Back in May, when most coins were rebounding, EOS actually exceeded its January highs, while other coins made lower highs. That is positive action.
Here is EOS over the last 14 months.
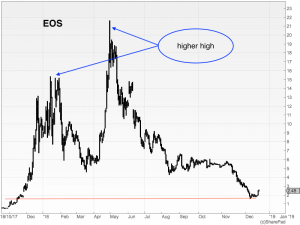
For those of you not familiar with EOS, its purpose is pretty much the same as that of Ethereum: to be a platform for decentralised applications (dapps). This means that, if we go through another spate of ICOs and EOS becomes the go-to platform, there will be a torrent of EOS buying.
Keep your eyes on EOS, folks. Ethereum still has a market cap four or five times higher, but the price action displayed by EOS is much better – and that bodes better for the future of the coin.
Here, FYI, is Ethereum over the same period of 14 months.
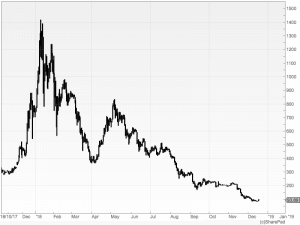
That’s all for today, folks. May I take this opportunity to wish you a happy Christmas and a bonanza 2019. Crypto-wise, it’s going to be a lot different to 2018. My bet is that 2019 is the year crypto will make its low.
I look forward to resuming again in 2019.
Dominic Frisby is author of the first (and best, obviously) book on Bitcoin from a recognised publisher, Bitcoin: the Future of Money?, available from all good bookshops, and a couple of rubbish ones too. Dominic is director of Cypherpunk Holdings (CSE:HODL), a company set up to invest in privacy-related technologies. Follow Dominic – @dominicfrisby
Disclaimer: The views and opinions expressed by the author should not be considered as financial advice. We do not give advice on financial products.
