Volatility is back, and it is back in a big way.
After several months of sideways action, which we described as “building cause”, we knew a big move was coming. We just didn’t know which way. I’m afraid it was to the downside.
The bear market is back on.
That’s the first and most important takeaway from today’s piece. This is a bear market. We hoped the sideways action meant it was coming to end, but it isn’t.
Bear markets are horrible. They can go on for longer than you think possible. They can sink further than you think possible. They are indiscriminate. The first priority is safety. You want to be as protected and de-risked as possible. You do not want to be losing money.
Let’s take a look at some charts. Let’s analyse the price and see if we can identify some targets.
Every line of technical support we have been drawn in recent weeks has been broken, whether in Bitcoin or any of the altcoins. The only coin, which is not in freefall, is Ripple. It will be.
Bitcoin Crash
Bitcoin was trading at $6,300 seven days ago. It has fallen 30% to $4,400 as I write.
For many months the pattern had been that while Bitcoin had maintained its support above $5,800, the altcoins had ground lower. Either Bitcoin was going to pull the alts back up, or the alts were going to drag Bitcoin down. The latter was the case. As soon as $5,800 was breached so was an avalanche.
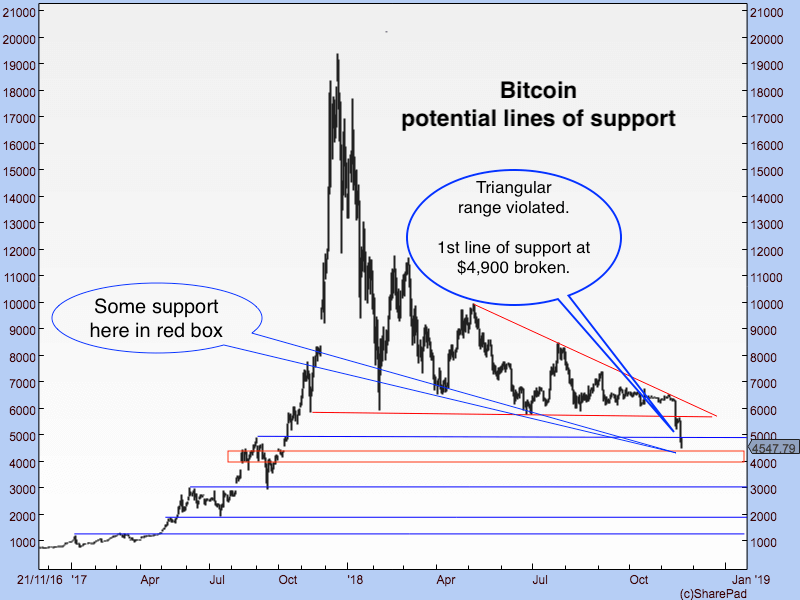
The triangular range in which Bitcoin has been trading, as identified by the red lines in the chart below, has now been violated. The next line of support was at $4,900. That has gone too.
I’m a big believer in the power of horizontal lines in technical analysis, by the way. They work surprisingly well for something so simple. As far as this method is concerned, the next obvious line of support I can see is at around $3,000. It proved to be both support and resistance on the way up.
Having said that there is some support in the low $4,000s where I have drawn the red box.

DF Bitcoin graph
The next line after that is just below $2,000. If that doesn’t hold, we head back to the original break-out point of $1,200.
Goodnight altcoins
If these levels get hit, heaven knows where the altcoins will be. In fact, many of them will not be. They will cease to exist. And, that by the way, is what needs to happen. There is a sea of speculative rubbish out there, and it needs to be washed away. That is what bear markets are for.
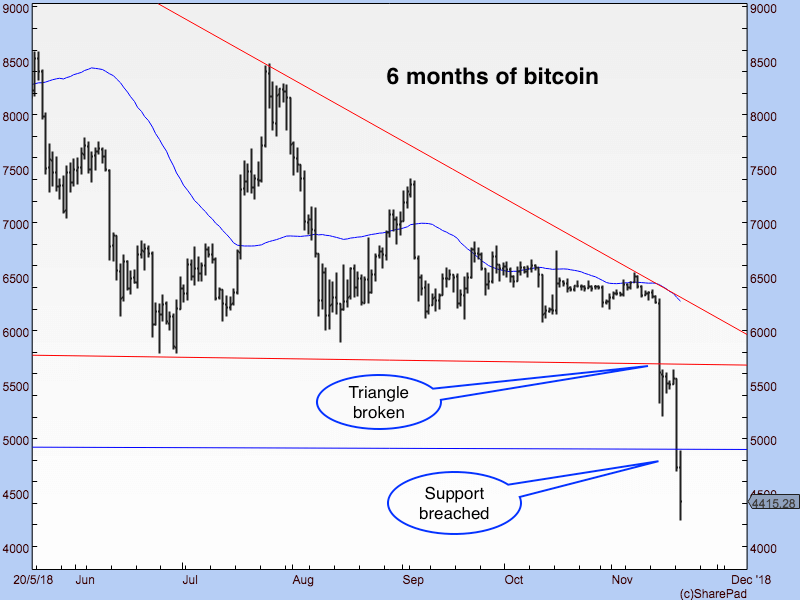
Here’s that same chart in close-up over the last six months.

DF Bitcoin six months graph
It’s crashing folks. My guess is that it ends outside the realm of this chart.
There’ll be all sorts of discussions in the pub about what’s triggered this. You can’t help thinking the Bitcoin Cash fork might have had something to do with it, as it all seemed to happen at once. But my view is that simple technical breach of the $5,800 level which had been support for so many months triggered a plethora of stops. We’ll find out the answer for sure in a few weeks or months, I guess – when it is too late to do anything about it.
Ethereum
I haven’t got room to show you charts of all altcoins, so we will use Ethereum as our proxy.
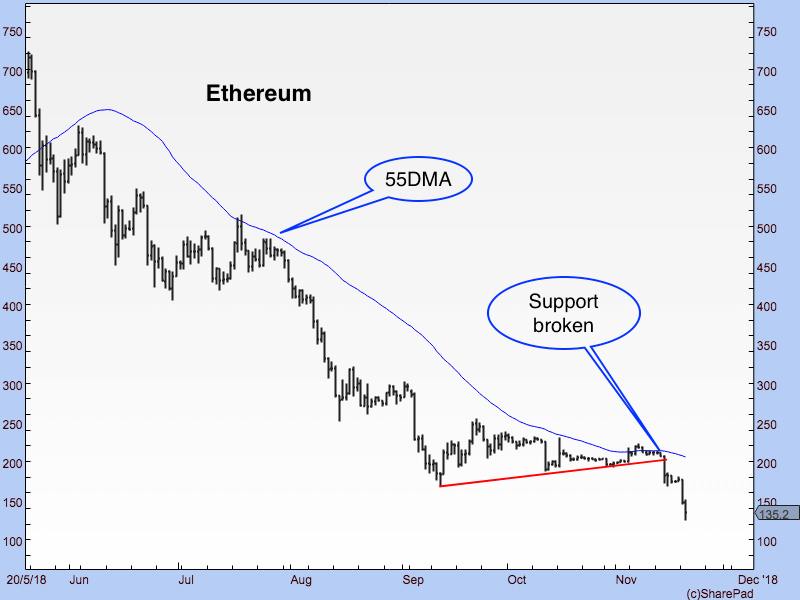
Here’s a chart of the last six months. The decline is exorable and it continues. There was support where I drew the red line, but that was breached and now we are in freefall once again. Note also, by the way, what an effective tool the 55-day simple moving average (55DMA) – the sloping blue line – has been. It’s been resistance all the way down. I love it as a simple, trend-following indicator.

DF Ethereum graph
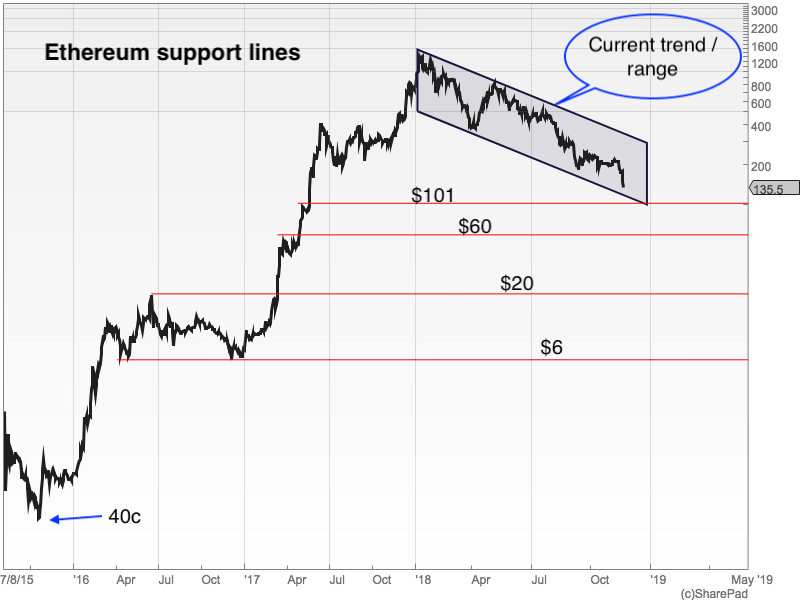
In terms of how far this one falls, I’m going to put the wind up you now by using a long-term log chart of Ethereum. This is what bear porn looks like.
First up, I’ve identified the current trend in grey – and we are near the bottom of the range.
Then I’ve drawn some horizontal red support lines, based on previous points of resistance. You can see they sit, using round numbers, at $100, $60, $20 and $6. I am not saying we will get there, but I am saying these targets are eminently reachable. $60 looks probable to me and I wouldn’t rule out $20.

DF Ethereum support lines graph
Overshooting
This is a market that went from 40c all the way to $1,400 or thereabouts. It was extraordinary. Bull markets go too far one way – particularly when the subject is some new tech – bear markets go the other way. They overshoot to the downside.
How do you identify what is fair value for something like Ethereum? It is hard. It is hard to see how you value something that is scalable. How do you value something that could be disrupted by some new coin that we haven’t even heard of yet? It’s why tech stocks generally attract such dispute around their valuations.
Whether it’s FANG or crypto the world has been in love with tech for a long time. Whether it’s FANG (which has also fallen off a cliff) sentiment has now gone the other way. Maybe that’s the explanation for this capitulation.
For now though, the trend is down. Be careful out there!
Dominic Frisby is author of the first (and best, obviously) book on Bitcoin from a recognised publisher, Bitcoin: the Future of Money?, available from all good bookshops, and a couple of rubbish ones too. Dominic is director of Cypherpunk Holdings (CSE:HODL), a company set up to invest in privacy-related technologies. Follow Dominic – @dominicfrisby
Disclaimer: The views and opinions expressed by the author should not be considered as financial advice. We do not give advice on financial products.
