
Market analysts have been calling for Bitcoin to finally succumb to selling pressure over the past few weeks, with price target predictions being called at $8,450 and $7,650.
However, the world’s largest cryptocurrency has defied the naysayers by surging 9% overnight.
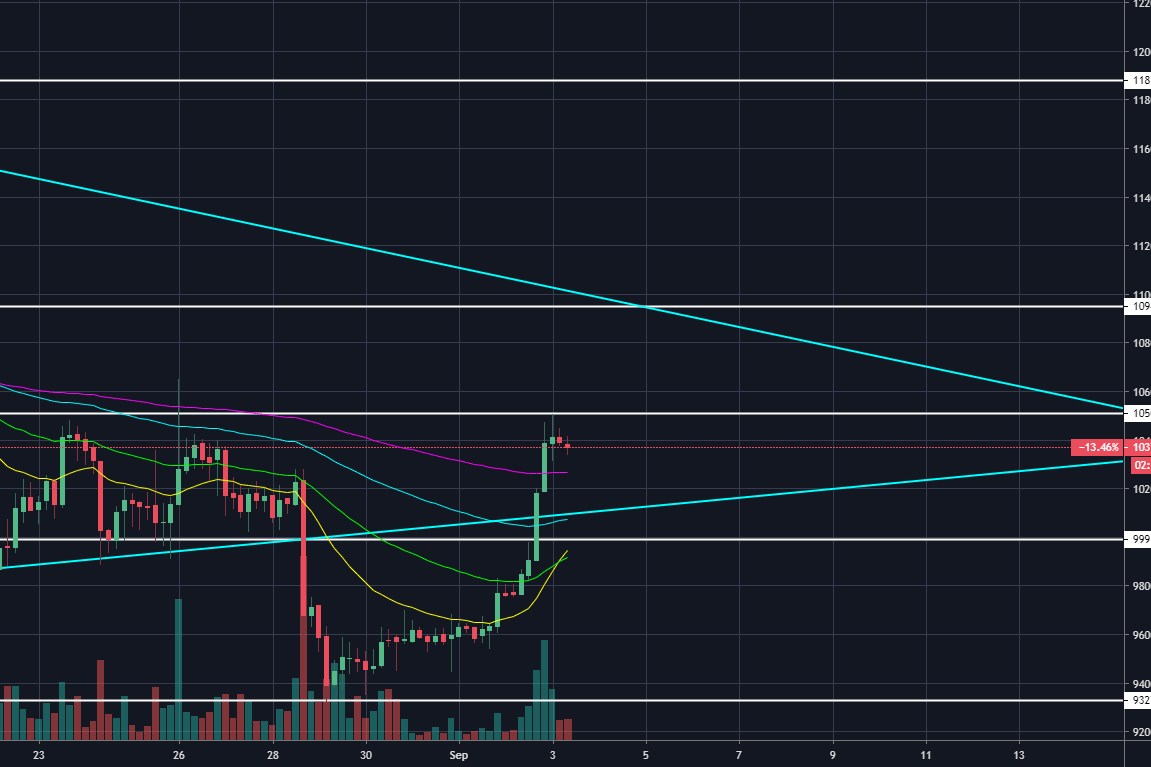
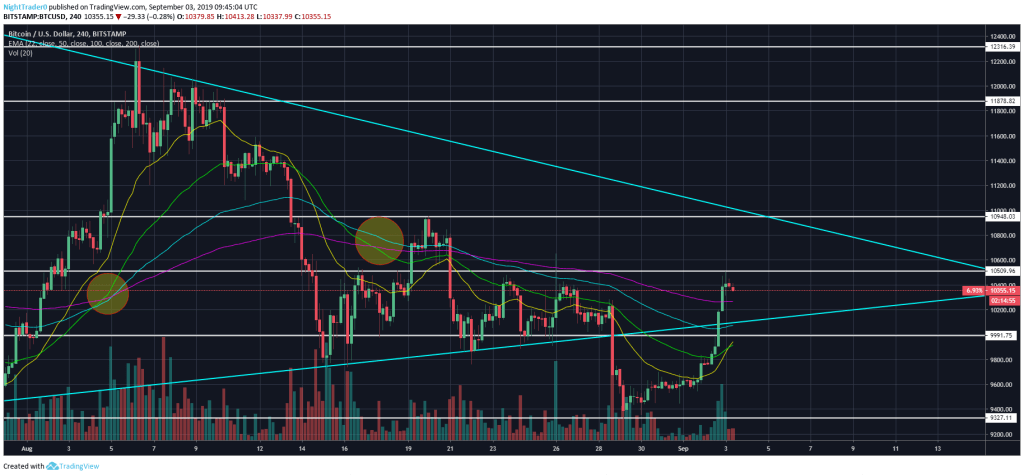
Bitcoin catapulted off the 100 EMA on the daily chart at $9,750 all the way to $10,500, leaving it firmly back in the bullish control zone.
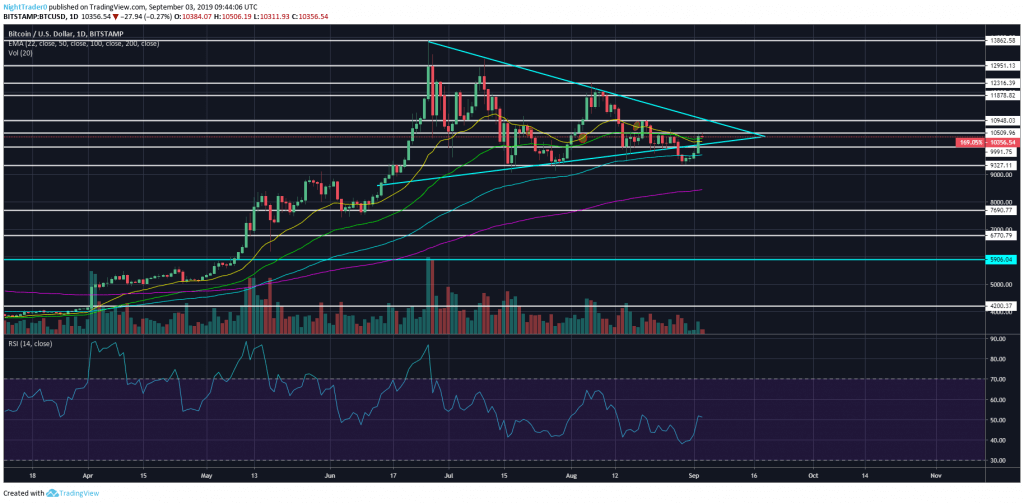
While the overnight rally was certainly a bullish move by Bitcoin, it still needs to take out the dreaded $11,000 level of resistance, which is currently in confluence with the diagonal resistance dating back to the $14,000 high on June 26.


A break above $11,000 would also signal the first higher high since the consolidation pattern began in June.
Currently, there have been four consecutive lower highs at $14,000, $13,250, $12,375, and $11,000, which is typically a bearish signal – as seen in the 2018 bear market.
From a short-term perspective, the $10,500 level is the first stumbling block as it has been a level of resistance dating back to mid-August.


The daily relative strength index (RSI) is currently at an indecisive point of 51. It stuttered at this point on August 19, with price proceeding to fall from $11,000 to $9,780 in a matter of days.
If price gets rejected again at $10,500, it would signify a fourth lower high that would almost certainly drive a bearish move to the downside.
If $9,350 breaks, targets remain at the 200 EMA on the daily chart at $8,450 and a historical level of support at $7,650.
For more news, guides, and cryptocurrency analysis, click here.
Denver, Colorado, 24th February 2025, Chainwire
Denver, Colorado, 20th February 2025, Chainwire
Washington, D.C., 18th February 2025, Chainwire
Dubai, UAE, 27th January 2025, Chainwire
Those who enter the market at this time may be surprised to hear that Bitcoin…
George Town, Grand Cayman, 22nd November 2024, Chainwire