
2018 was a tumultuous time for cryptocurrencies. In this article, we’ll take a look at some key network statistics from the Bitcoin (BTC) blockchain over the last 12 months. The areas we will dive into today will be network hash rate and also daily confirmed transactions.
In the data, we will look at the ranges for the year and what factors have been behind the trends, and finally share some thoughts about how things may play out in 2019.


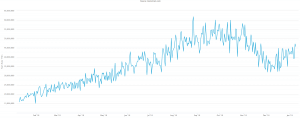
The chart above shows the number of tera hashes per second (TH/s) the Bitcoin mining network was running at during the last 12 months. This data gives you an idea of the amount of mining hardware currently online and mining for blocks on the network.
After starting the year at under 20,000 TH/s mining power, the Bitcoin network climbed all the way up to over 50,000 TH/s between September and October 2018. Since that peak, for the first time in many years, we saw the hash rate drop. This drop was a result of miners going offline due to a substantial decrease in miner profitability following the selloff in the market as well as increased competition for Bitcoin block rewards (which was a result of the increase in hash rate).
Hash rate fell back to around 30,000 TH/s towards the end of 2018. However, it looks like hash rate is again on the rise. This may be driven by a few factors, but I would think the largest one at play would be the introduction of next-generation mining chips and hardware.
Over the last couple of years, Bitmain has dominated the market when it comes to the manufacturing of Bitcoin mining equipment, and their Antminer S9 series is by far the most popular miner available today. However, in 2019, a number of other competitors will be bringing new 10 and 7-nanometer mining chips to the market. With the increased efficiency expected in the new generation of hardware, I again expect to see a continued uptrend in network hash rate for 2019.
This statistic relates to the number of daily confirmed Bitcoin transactions (meaning they were successfully added to a block on the blockchain) over the last 12 months.
From the data, we can see that after a steep decline during the volatile first quarter of 2018, daily transaction volume steadily increased over the course of the year. We can see a distinct ascending channel forming for network activity from an early 2018 range of between 150,000 and 200,000 transactions a day to much closer to 300,000 transactions a day by the end of the year.
Apart from the general increase in adoption and usage of the Bitcoin blockchain for transactions in 2018, we also saw the introduction of things like segwit and better batch transaction management for exchanges. Developments like this have undoubtedly helped to lower average transaction fees and subsequently increase the usage of the Bitcoin blockchain for things like atomic swaps and other Layer 2 applications like the Lightning Network.
I very much expect this uptrend to continue into 2019. It’s true that over the last 12 months, we have seen some fantastic innovations on competing open blockchains. However, Bitcoin is still the world’s most decentralised, battle-tested, and secure blockchain. With this in mind, I only expect to see the trajectory increase for daily transactions in 2019.
Denver, Colorado, 24th February 2025, Chainwire
Denver, Colorado, 20th February 2025, Chainwire
Washington, D.C., 18th February 2025, Chainwire
Dubai, UAE, 27th January 2025, Chainwire
Those who enter the market at this time may be surprised to hear that Bitcoin…
George Town, Grand Cayman, 22nd November 2024, Chainwire