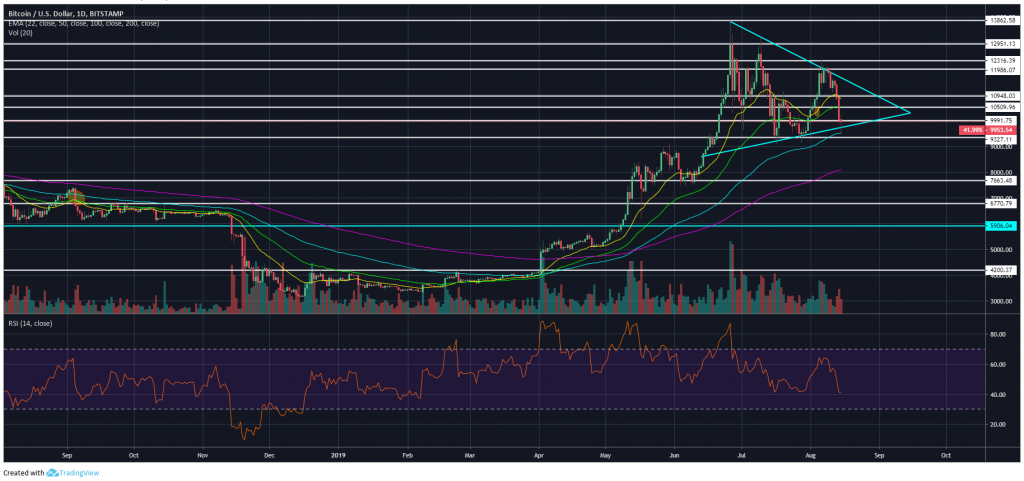
Bitcoin is 14% down since Monday after it failed to breach the upper side of a symmetrical triangle that has been forming since June 26.
The fall in price has resulted in a third lower high in just under two months, with Bitcoin failing to achieve a price above the previous highs of $14,000 and $13,250.
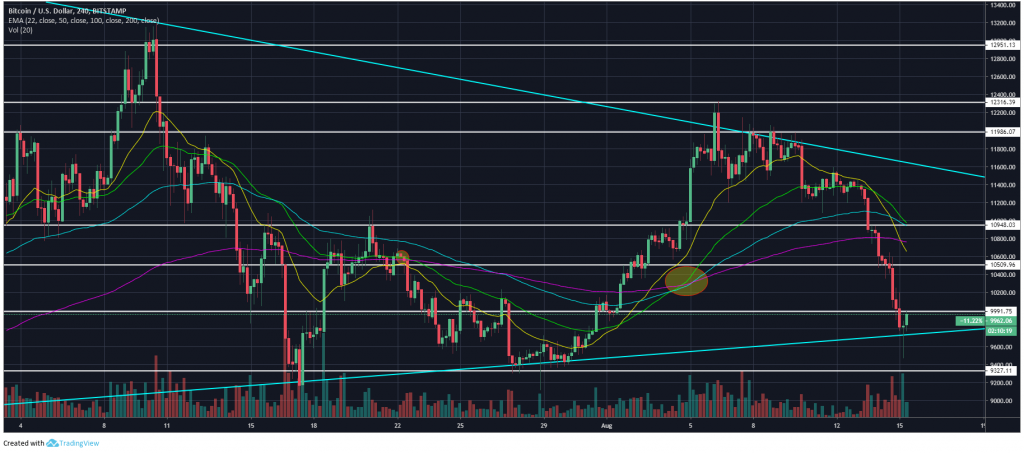
However, despite falling below $10,000, Bitcoin found support on the daily 100 exponential moving average (EMA), bouncing by 4% just hours after the move to the downside.

For now, the lower side of the symmetrical triangle has held, which could indicate a retest of $10,450 in the coming days.
On the four-hour chart, the shorter-term EMAs are ticking to the downside, with a dreaded death cross potentially on the cards if price remains below $10,000.
The daily relative strength index (RSI) is at its lowest point since February at 40.23, although there is still room for it to go lower as Bitcoin saw a tick to 25.70 in December and a low of 9.32 in November last year.

If the symmetrical triangle breaks to the downside, traders will be expecting a drop to the $8,700 level of support before a test of the 200 EMA on the daily chart, which is just above $8,000.
The severity of this morning’s decline in price is a worrying sign for Bitcoin bulls, who were optimistic and almost euphoric when price nudged above $12,000 last week.
The fall in the price of Bitcoin has also coincided with a bloodbath for altcoins, with the likes of Bitcoin Cash, Litecoin, and XRP all experiencing more than 10% declines as $18 billion has been wiped off the entire cryptocurrency market cap.
For more news, guides, and cryptocurrency analysis, click here.
Disclaimer: The views and opinions expressed by the author should not be considered as financial advice. We do not give advice on financial products.
