A recent article from Bloomberg has shed light on a study that claims the 2017 bull market was fueled by one giant Bitcoin whale.
The report states:
“A Texas academic created a stir last year by alleging that Bitcoin’s astronomical surge in 2017 was probably triggered by manipulation. He’s now doubling down with a striking new claim: a single market whale was likely behind the misconduct, seemingly with the power to move prices at will.”
I myself am of the opinion that there isn’t sufficient data to back up these claims – especially when you look at sources like Google Trends, which shows a completely different outlook.
My goal today is to explain the paper’s analysis of the alleged market manipulation and why I personally believe it could be incorrect.
Report conclusions
A lone whale was behind Bitcoin manipulation in 2017, Texas academic says https://t.co/PEYcYxByue pic.twitter.com/ltUY0u8ZAG
— Bloomberg Crypto (@crypto) November 4, 2019
The two scientists who wrote the academic paper, University of Texas Professor John Griffin and Ohio State University’s Amin Shams, claim there is one sole culprit behind the exuberant price action of late 2017:
“One entity on the cryptocurrency exchange Bitfinex appears capable of sending the price of Bitcoin higher when it falls below certain thresholds.”
The results published by the academics appear to show that there was one account responsible for most of the volume on the exchange, which seems a bit odd to me (see why below).
In addition, the professors claim that years from now, people will be surprised investors handed billions of dollars to companies like Bitfinex.
Bitfinex has rejected the claims, with General Counsel Stuart Hoegner arguing in a statement that the paper is “foundationally flawed” because it is based on an insufficient data set.
What does Google Trends show?

Even though Bitfinex was never audited, I find it hard to believe there was one single account responsible for most of the price action in late 2017.
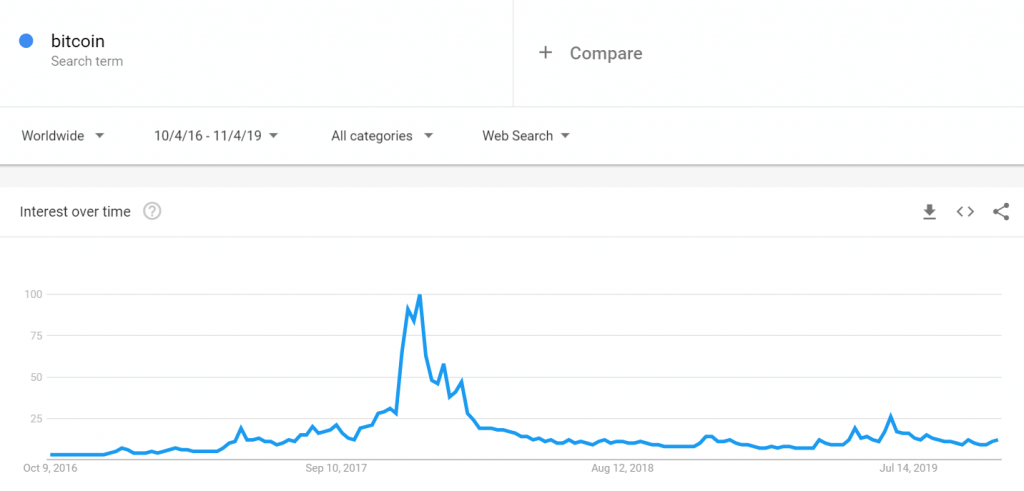
Just by looking at the Google Trends chart above, we can see the huge amount of interest from retail investors in the cryptocurrency market. What Google Trends clearly shows is that interest in Bitcoin peaked when the asset was near all-time highs.
To me, that shows most of the buyers were retail investors wanting to sell for profit.
In addition, the number of coins being traded on Bitfinex was quite limited when compared to other platforms like Binance. It’s then hard to believe one account was able to push the altcoin market without touching altcoins directly.
What does the exchange volume show?

Even though I believe most buyers were retail investors and not institutions, the argument that one account was responsible for most of the 2017 bull market could still stand. After all, I mentioned buyers, not sellers.
To have a better understanding of how the market looked back then, I decided to research the total exchange volume over the last five years.
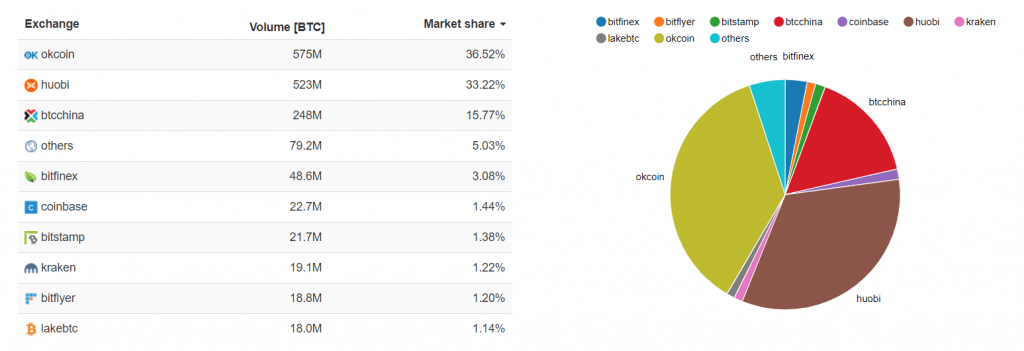
Looking at the information above – courtesy of Bitcoinity – you can see the total volume over the past five years per exchange. Bitfinex comes in fifth place, with a much lower volume than exchanges like OKCoin or Huobi.
I carried out the same research using a number of alternative sources, and most showed similar data for the past year, at least.
Hodler waves

The last piece of data I’m taking into account for my brief analysis is the Bitcoin UTXO age distribution chart, also known as hodler waves.
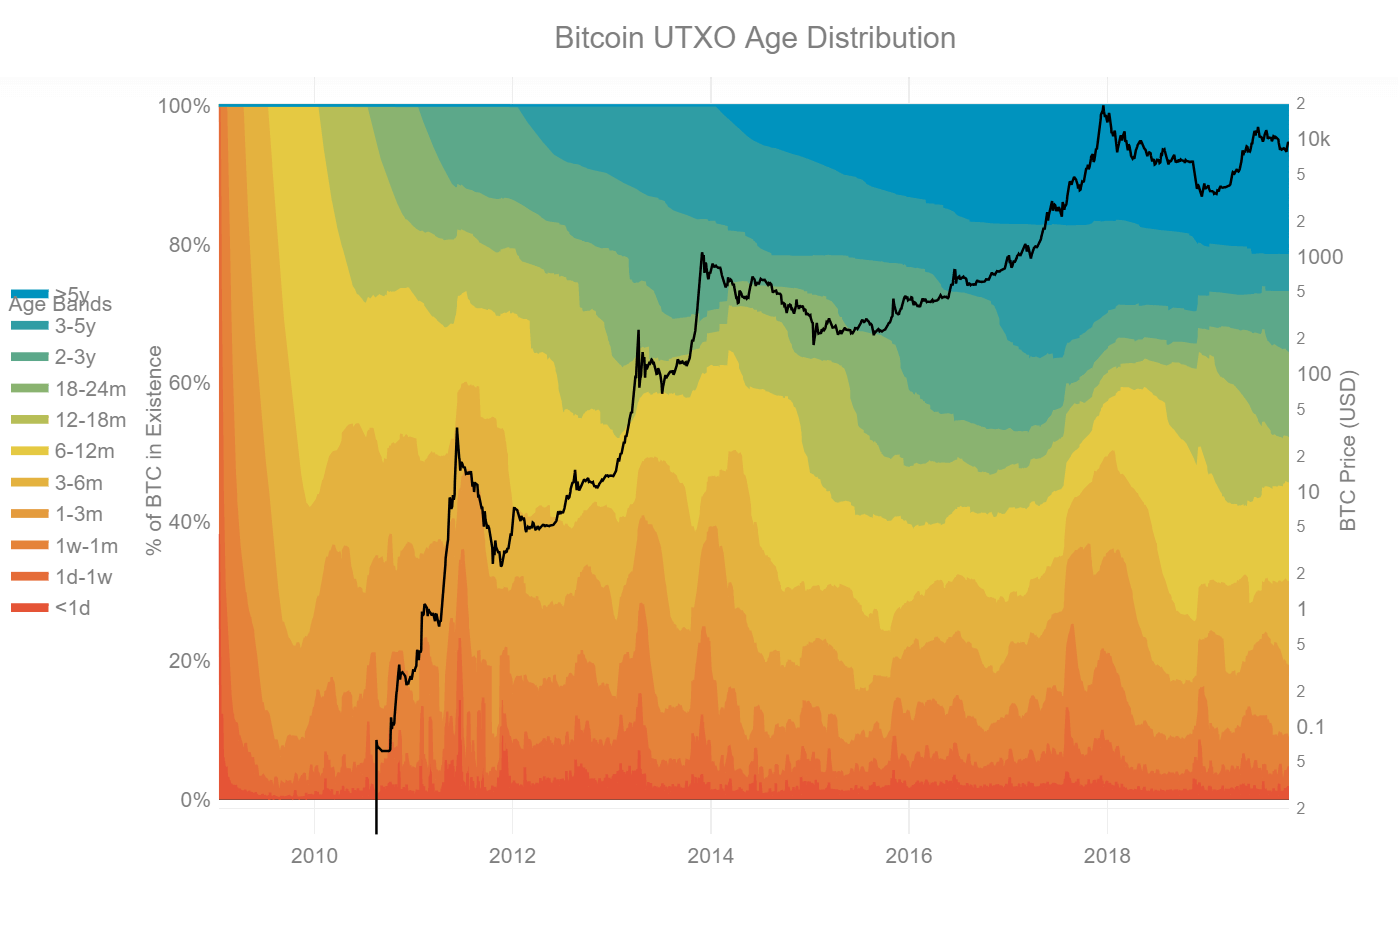
What the image above – courtesy of the Unchained Capital blog – clearly shows is that Bitcoin users who had held BTC for over five years began to sell during the bull run.
The red, yellow, and orange bands at the bottom highlight the movement of Bitcoin from an old address to a new address. When you look at late 2017, during the bull run, you can see a sudden spike. That means a bunch of hodlers probably sold, since a large number of Bitcoin went from an old address to a brand new one.
An opposite view could argue hodlers were simply switching addresses. However, that seems to be unlikely.
Interestingly enough, the number of hodlers continued to increase after the 2017 bull run, which shows there’s a great deal of BTC users who are in the market for the long term.
Don’t forget that close to 40% of all BTC is locked in addresses where the coins haven’t moved for at least two years – a clear sign the number of hodlers is increasing and the market is becoming more decentralised.
In conclusion, it seems hard to believe that one single whale was responsible for most of the price action during the bull market of 2017.
Disclaimer: The views and opinions expressed by the author should not be considered as financial advice. We do not give advice on financial products.
