Relief came to the crypto markets last week. Most coins registered such impressive double-digit gains that many pundits are now declaring the bear market now over. I’m not so sure.
Let’s take a look at the charts, and see what they are telling us.
First up, the daddy, Bitcoin…
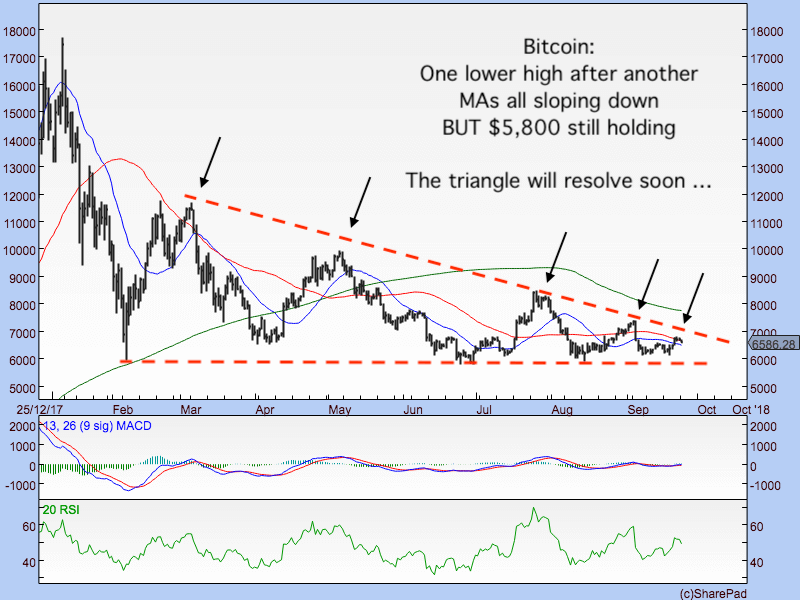
Yet again last week Bitcoin did what it has been doing for months: it put in another lower high. That has been the defining characteristic of Bitcoin in this bear market. Each high (marked by the black arrows) is lower than the last, but, at the same time, $5,800 continues to hold. The result is that we have this triangle pattern, which has formed over many months, as outlined by the dashed red line.
The range, however, is getting narrower and narrower. At some stage in the next few weeks, this triangle is going to end. We may then get some resolution as to which way bitcoin plans to go.

Neither of the momentum indicators – MACD and RSI – are telling us a great deal. MACD is as flat as the bitcoin price itself.
The 21-day (blue), 55-day (red) and 233-day (green) simple moving averages are all sloping down. That is indicative of downward trends in the short, medium and long term. Not good. At the moment Bitcoin is kind of butted against the 21 and 55-DMAs. We want to see it break above, but for now they have capped this rally.
It’s all a bit undecided.
Looking at Ripple…
Moving on to the altcoins, Ripple had an absolutely bonanza time of it last week (and we hinted last week a rally might be possible, though I never saw a tripling in three days on the cards). I still don’t get Ripple, I never have. But it momentarily overtook Ethereum to become second largest coin by market cap, adding over $10bn of value last week. Shows you what I know.
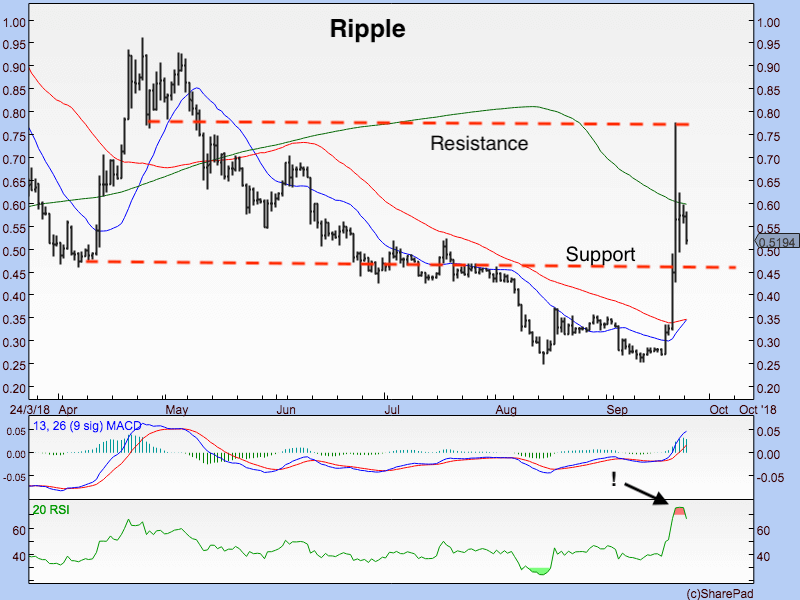
Sudden spikes have characterised Ripple since its inception. It went from 25c to 78c, and has already given back over 50% of those gains and now sits at 51c as I write.
Let’s look at a six-month chart.
I’ve drawn two horizontal dashed red lines where there are now fairly obvious areas of resistance and support, and we can expect last week’s spike to drift back to the 45c area. Bulls will want that to hold.

I’m guessing that Ripple was fairly heavily shorted and so short-covering caused that spike. We’ll find out soon enough. Those kind of explanations don’t really matter to traders as, once you know, it’s usually too late to do anything about it.
Worrying for Ripple is how quickly it became overbought as measured by RSI (see the black arrow). It’s now back below its 233-day moving average, which is sloping down, but, unlike most coins, it’s well above its 21- and 55-DMAs which are converging at 35c.
This isn’t a chart I’m going to be buying into. If anything I’d be selling it, as, if sector-wide malaise takes hold again this week, it could easily slip back 35c.
Meanwhile, Monero…
I’m particularly keen on the privacy coins – it’s one of the reasons I’ve just become director of Cypherpunk Holdings (CSE:KRI) – a company which has been set up to invest in privacy technology. So let’s take a look at Monero next.
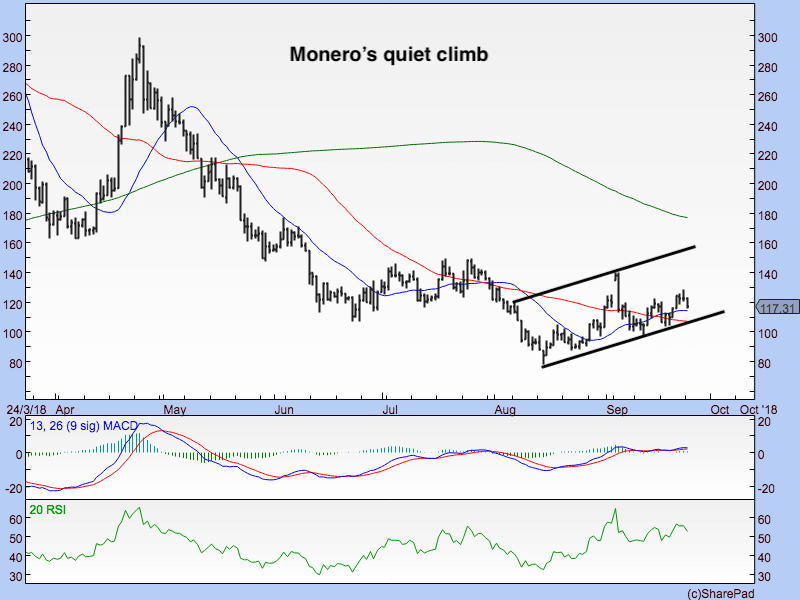
I’m biased, but I have to say, I like what I am seeing here. We have a sequence of higher lows since mid-August. It has crept above its 21- and 55-DMAs (red and blue lines). We have a nice little uptrend in place. What I like about it is the parameters are fairly clear (I’ve outlined them with the parallel trend lines in the chart below).

Nobody’s talking about Monero, and yet it’s quietly climbing. Stealth bull markets are the best kind of bull markets.
We want to see that lower trend line holding, we want to see the blue and red lines holding as well, and starting to slope up.
But there’s your risk, nicely defined.
Over to the altcoins…
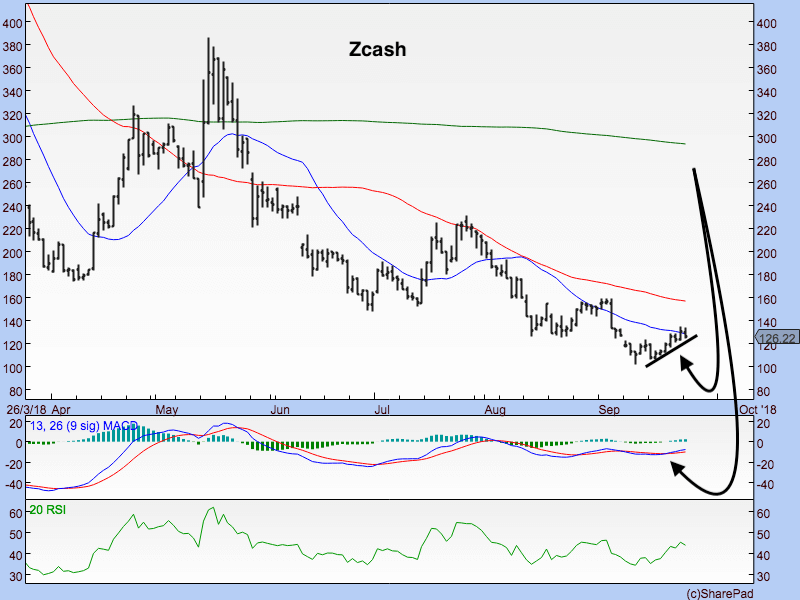
The other leading privacy coin, zcash, is not looking quite as good. Typical of the altcoin sector as a whole, its September low was lower than its August low, which was lower than the one before that.
The downtrend is still intact, and it hasn’t yet even got above its 21-DMA (blue line).
On the other hand, it has over the past week, started something of an uptrend, and MACD has crossed in a favourable way (see two black curly arrows). So there is a positive straw to clutch at in the short-term. But the broader trend is down.

There seem two be three categories of altcoin. Some, like Monero, are stealthily creeping up, having made a higher low in September. Others, like zcash, continue their downtrends. The third category is those which have made something of a double bottom .
Of the top ten coins by market cap, in the former category – ie looking better – we have EOS, Binance coin, dash, IOTA, Stellar and NEO (just).
In the stuck in their downtrends category we have Ethereum, Bitcoin Cash, Cardano and Litecoin.
In the double bottom camp we have Ripple, NEO and TRON.
Ripple has shown what’s possible. The coins to back are those exhibiting strength – ie the Monero category. Those to shy away from and those making lower lows.
But the bigger picture at play here is how Bitcoin’s triangle resolves. If it goes to the upside, then all boats will sail. If $5,800 doesn’t hold, then most boats will sink. If it continues to meander (which I think is likely); then the market will continue to whittle out the altcoins, separating the winners from the losers.
DF
Disclaimer: The views and opinions expressed by the author should not be considered as financial advice. We do not give advice on financial products.
