What are market cycles?
Market cycles are a long-term price pattern used when technically analysing price of cryptocurrencies, stocks or fiat currencies.
The theory of market cycles is incredibly prevalent in cryptocurrency, with Bitcoin’s price succinctly completing a full cycle no less than five times in its ten year history.
The benefit of using historical cycles in technical analysis is that it gives an indication of when a bear market can turn into a bull market, and visa versa.
Are market cycles accurate?
There are many theories as to why market cycles happen and why they’re so accurate, one of which is the psychological and emotional phases over investors during a particular stage of a market.
For example, during Bitcoin’s 2014 bear market the overall sentiment in the space could be closely compared to that of 2018, with a number of investors feeling emotions like uncertainty, denial, anger and even depression.
Wall Street Cheat Sheet Feel better in this down market pic.twitter.com/PVvMLRqWDf
— InsaneInDaBlockchain (@InsaneInDaBlock) November 19, 2018
The Wall Street cheat sheet summarises various phases in market cycles, beginning with disbelief, hope and optimism and ending in capitulation, anger and depression before cycling back around to disbelief.
Market makers prey upon inexperienced retail investors who typically feel the emotions stated above. They can do this in cryptocurrency by driving price down to force investors to sell before scooping up all of the sell orders with a move to the upside.
In the history of Bitcoin there have been five notable parabolic rises, followed by sharp declines. The first of which was in 2011, when Bitcoin reached $35 before crashing 94% to just $2. Two months later the cycle accelerated again, culminating in a sharp incline to $12 before a crash back down to $2.
It wasn’t until 2013 when the larger numbers started coming into play, Bitcoin made a high of $249 before experiencing an 82% drop to $45. Two years later it happened again, this time Bitcoin made an impressive all-time high of $1,141 before falling 86% to $152.
80% and counting $BTC pic.twitter.com/cCsKfk7iBh
— Peter Brandt (@PeterLBrandt) November 21, 2018
It’s worth noting that throughout these volatile cycles, the mainstreams view on cryptocurrencies became enhanced, with traditional traders and mainstream media being quick to label crypto as a bubble when a sharp decline came into play, only to remain quiet during the parabolic rises to the upside.
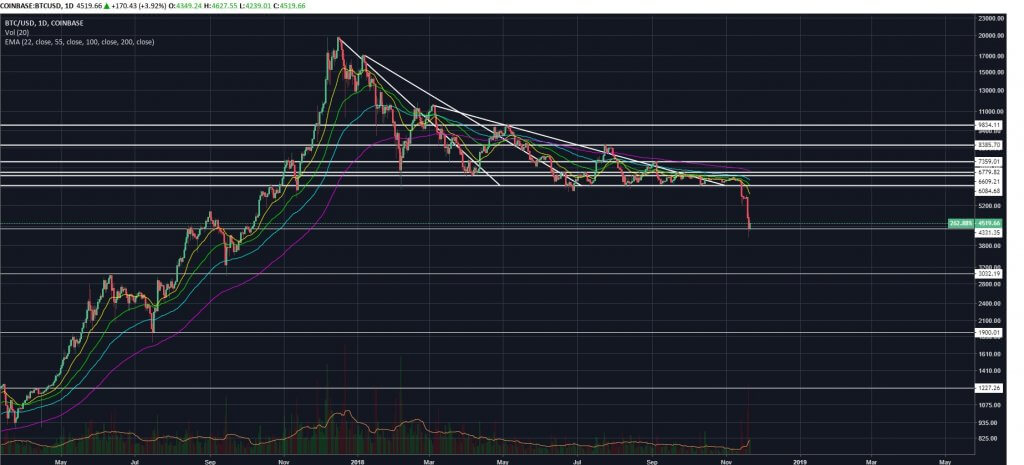
The latest cycle has happened over the past 12 months. Bitcoin rallied up to $20,000 in December of 2017, subsequently falling almost 80% to 2018’s November lows of $4,065. The amount of downside has been reflective of another market cycle, with many traders and analysts predicting that a bottom will come into play before the year’s end following November’s aggressive move to the downside.
How to capitalise from market cycles
The point of maximum financial opportunity is at the bottom of the market cycle. When a market has dropped, in crypto’s case by 80%, it might be a good time to start buying as historically it will take between 30 and 169 weeks before cycling back to a new all-time high.
To assess the market sentiment and emotional tone of the markets a good place to look is media outlets, social media and word of mouth. If everyone involved in the space is screaming to buy in a euphoric tone, it is probably a good time to sell as that’s an indication of a move back to the downside.
On the other hand, if the market enters a phase of capitulation where even seasoned traders consider exiting the market, then is a good time to buy. The key is to buy when everyone else is selling, and to sell when everyone else is buying in a cloud of emotion.
What phase is Bitcoin in now? (November 2018)

Bitcoin and the cryptocurrency markets in general just experienced a major sell-off, falling to as low as $4,000 after last December’s all-time high of $20,000. The recent move to the downside saw a number of traders in the market reach stages of panic, which is often a precursor to capitulation.
Capitulation is a point where price breaks through support that was previously seen as impenetrable. It is also a point where a lot of investors exit the market to avoid more losses. A point of capitulation in Bitcoin’s case could be if the price goes past the $3,000 level of support, potentially to as low as $1,000 before the market cycles back around.
For now, Bitcoin remains in a downtrend that could continue for months. A bear market has the ability to frustrate traders to the brink of exiting the market. A full reversal would only come into play with strong move to the upside taking out $6,150, $6,800, $10,000 and $11,800 on its way.
For more guides on cryptocurrencies, exchanges and blockchain technology, click here.
Disclaimer: The views and opinions expressed by the author should not be considered as financial advice. We do not give advice on financial products.
