The cryptocurrency market is considered by many to be ‘too volatile’ and ‘too illiquid’ to trade successfully; altcoins saw up to 2,000% gains in 2017 before a 95% plummet in 2018. However, with the right mindset and trading tools you can make the cryptocurrency market a more lucrative option than traditional legacy markets.
The key is risk-management, and to profit on volatile swings in both directions. For example, if Bitcoin reaches a high of $20,000 and you think that the rally is coming to an end, trade into one of the USD or Euro backed stable-coins so you’re holding an effective cash position, then re-buy lower. You can also ‘short’ Bitcoin on exchanges like Bitfinex, BitMEX and Deribit, which will mean you profit when the price moves to the downside.
But aside from that, here are a few hidden tools to give you an edge over other traders in the space.
Tradeflow
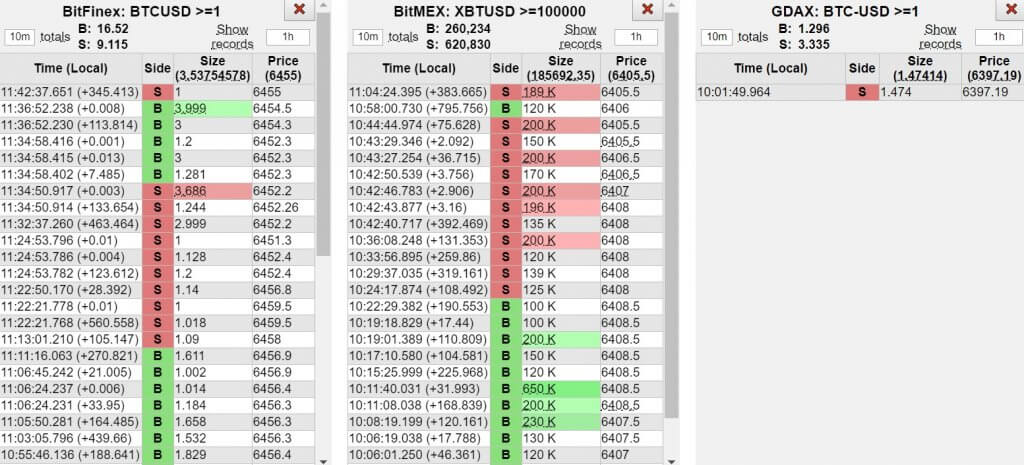
Tradeflow is a market order aggregator that continuously updates market orders across Bitfinex, BitMEX and GDAX. The benefit of comparing orders across exchanges is to assess the overall confidence in the market. For example, if a $10 million market buy comes in from BitMEX, the other exchanges will most likely follow.
The tool also keeps a tally of the total amount bought and sold within a preset time, this is important as you can see just how much of the reported volume is due to buying and how much is due to selling, which is a key insight into the ongoing market sentiment.
Tradeflow has become increasingly important over recent weeks, as Bitfinex has often traded at up to a 10% premium against BitMEX and GDAX. The order flow displays the live price orders are bought at, succinctly presenting the premiums across exchanges which could offer arbitrage trading opportunities to those watching.

Datamish
Datamish is a tool that uses Bitfinex and BitMEX’s API to present data on the long vs short ratio and liquidations. The benefit of using a platform like Datamish is the ability to assess market sentiment and any upcoming price-action.
An example for this would be if the long/short ratio was heavily weighted to the short-side, it could mean a short squeeze is coming, which would see short positions be liquidated during a move to the upside.
Datamish also present statistics on the amount of liquidations on BitMEX, this can be a good indicator to assess the market sentiment over a particular period of time.

Bitcoinity
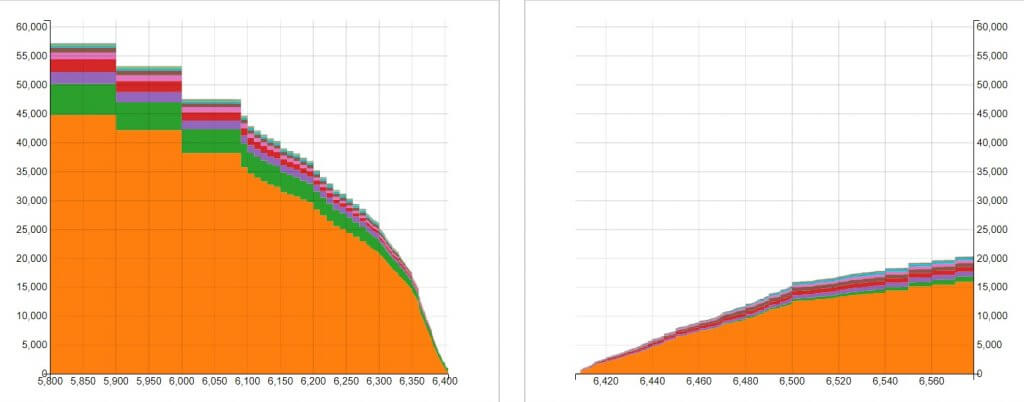
Bitcoinity is a tool that displays combined cryptocurrency order books, combining liquidity across all major exchanges. The benefit of using a tool like this would be to assess the levels of support and resistance, as well as working out at which price-point major liquidity lies.
For example, if the price of Bitcoin was at $6,400 and there were 40,000 Bitcoins on the buy-side of the orderbook above $6,000, but there was 75,000 on the sell-side below $6,800, it could be an indication that sell pressure is mounting and that price-action could move to the downside.
Another crucial tool on Bitcoinity is its arbitrage table. This details the price differences between exchanges, which can be capitalised on through arbitrage trading. An example of how you can make money through this is if Bitcoin is priced at $6,400 on one exchange and $6,500 on another exchange, you could simultaneously buy on one exchange and sell on another, capitalising on the $100 difference in price.

Tensor Charts
Tensor charts is a free, advanced charting tool that allows users to chart and visualise the major cryptocurrencies using orderbook heatmaps. Heatmaps collate data from orderbooks across various exchanges, presenting red and green blocks for filled buy or sell orders and blue and yellow blocks for orders waiting to be filled on each side.
When used correctly Tensor charts can be an excellent way of foreseeing price-action, it allows you to see buy or sell walls as well as spoofed orders, which can in-turn give you an impression of what the market makers are doing. See the video below for a brief tutorial on the heatmap visualisation.
https://www.youtube.com/watch?time_continue=17&v=YZCUMtV8rBU
Cryptowatch
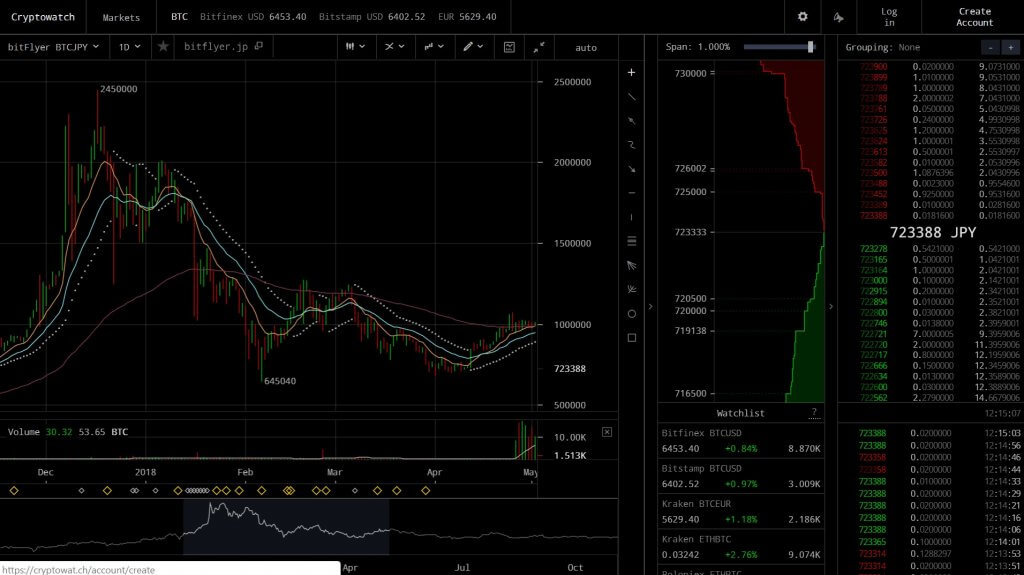
Cryptowatch is a free charting resource that allows users to track charts from every major cryptocurrency exchange. Owned by Kraken, Cryptowatch combines data from the likes of Bitfinex, Coinbase Pro and Bittrex as well as Japanese exchange BitFlyer and Korean exchange Bithumb.
Users can use this to their advantage by watching the BTC/JPY chart and comparing it with the BTC/KRW or BTC/USD chart, this would show whether particular markets are front-running others, for example back in May 2018 Bitflyer was using 1,000,000 JPY as a key level of resistance, which eventually turned into support. This level was respected across all exchanges until BitFlyer eventually broke down, cascading downside across all exchanges.
Within cryptowatch users can use common trading indicators like exponential moving averages, RSI, MACD and many more, making it one of the main competitors to TradingView in the cryptocurrency space.

Disclaimer: The views and opinions expressed by the author should not be considered as financial advice. We do not give advice on financial products.
