
The relative strength index (RSI) was originally conceived by J. Welles Wilder in 1978. He published the idea in ‘New Concepts in Technical Trading Systems’, and in ‘Commodities’ magazine (now ‘Futures’ magazine) in the June 1978 issue.
The RSI indicator generally sits below the chart of a security, with lines drawn at the midway point, and the upper and lower levels. It is classified as a momentum oscillator.
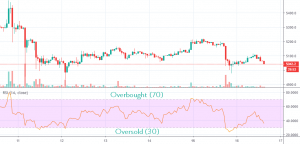
The concept was based on the idea that a security (or crypto asset) that goes through a rapid rise in price will, at some point, be overbought. Conversely, a security or asset that moves rapidly downwards in price, will at some point be oversold. RSI moves between levels of 0 and 100, and is considered overbought when above 70 and oversold when below 30. So Wilder recommends the upper and lower levels are drawn at those levels. However, he also pointed out that if the security or asset you are monitoring is regularly straying above/below these points, it may be more accurate to expand the levels up/down.
The general starting formula for RSI is:
RSI = 100 – [100 / ( 1 + (Average of Upward Price Change / Average of Downward Price Change ) ) ]
The result will increase as the size and amount of upward closes increase, and will decrease as the size and amount of downward closes increase. When we have over 14 periods of data, we can then smooth out these results over time, using the below formula:
Smoothed RSI =
[(Previous Average Gain) x 13 + Current Gain]/14
_____________________________________
[(Previous Average Loss) x 13 + Current Loss]/14
This smoothing means the result will only trend towards 0 or 100 in a very strongly trending market.
One method used with RSI is to monitor divergence. A bullish divergence is identified as the RSI forms higher lows as the price forms lower lows. Conversely, a bearish divergence is identified as the RSI forms lower highs as the price forms higher highs.
Another method is to look out for ‘swing rejections’. A bullish swing rejection would be indicated when the RSI falls into oversold areas, then crosses back above the 30% line, forms another move downwards without crossing back into oversold areas, and then breaks the recent high.
The above shows an example of this. The opposite of all of the above would be a bearish swing rejection. It is important to compare this signal to the overall long-term trend, as it is more likely to be correct when aligning with the long-term chart pattern. Otherwise, this swing rejection may simply be a false alarm. The RSI is most accurate when a market is constantly moving from bearish to bullish periods.
As with all trading analysis tools, they should be used with caution and an overall understanding of markets. No concept, including RSI, is guaranteed to be successful. So as many in the crypto community warn, “DYOR” or Do Your Own Research! To find out everything you need to know about trading cryptocurrency, make sure you download this definitive guide.
You can create an account and start buying cryptocurrencies now, here!
Denver, Colorado, 24th February 2025, Chainwire
Denver, Colorado, 20th February 2025, Chainwire
Washington, D.C., 18th February 2025, Chainwire
Dubai, UAE, 27th January 2025, Chainwire
Those who enter the market at this time may be surprised to hear that Bitcoin…
George Town, Grand Cayman, 22nd November 2024, Chainwire