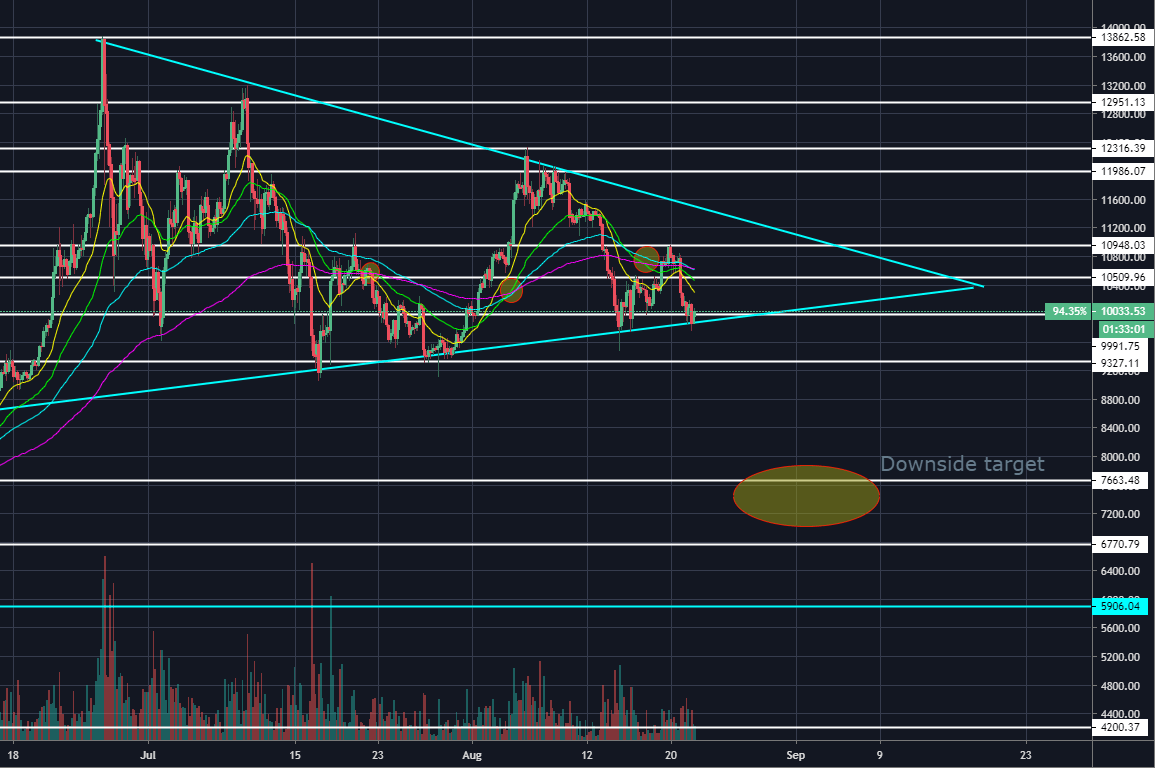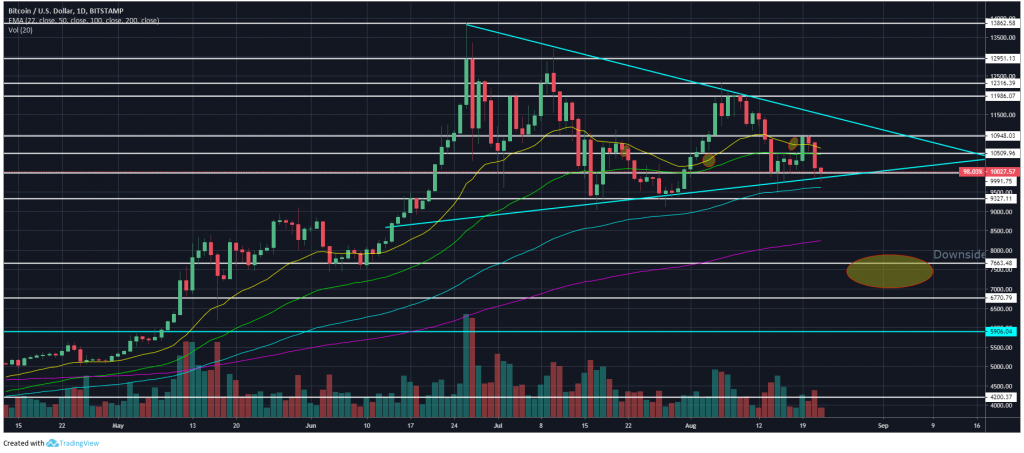

Bitcoin looks primed for a major move to the downside following a two-month period of consolidation above $10,000.
The world’s largest cryptocurrency is on the brink of breaking a major level of support which is in confluence with the lower side of a symmetrical triangle and the 100 EMA on the daily chart.
Bitcoin failed to avoid a fourth lower high in two months on Monday, falling by 10% after being rejected from the $10,950 level of resistance.


BTC is now sitting precariously above the $9,850 level of support. A four-hour or daily candle close below that level would present a new bearish phase in the market, with downside targets coming in at $8,250 and $7,350.
The daily 200 EMA is currently at the $8,250 mark, which looks like a key profit-taking level for seasoned digital asset traders.
The 50 EMA on the weekly chart was used as a bitter point of resistance throughout the bear market in 2018 as well as before the breakout to $14,000 earlier this year. This could be a key level of support if a breakdown plays out as it lies in confluence with the $7,650 level.
The weekly and daily relative strength indices (RSI) are also ticking to the downside, showing signs of bullish exhaustion following a 350% rally to the upside from March to June.
Although the outlook for the coming weeks looks rather bleak, there is a slight bullish case for Bitcoin. If it can bounce from the lower side of the symmetrical triangle to above $10,950, price could potentially break out to the upper side of the triangle. A breakout from this point could well result in a retest of yearly highs at $14,000.
For more news, guides, and cryptocurrency analysis, click here.
Denver, Colorado, 24th February 2025, Chainwire
Denver, Colorado, 20th February 2025, Chainwire
Washington, D.C., 18th February 2025, Chainwire
Dubai, UAE, 27th January 2025, Chainwire
Those who enter the market at this time may be surprised to hear that Bitcoin…
George Town, Grand Cayman, 22nd November 2024, Chainwire