
Earlier this year, I discussed one of my favourite models for price prediction: the Bitcoin stock-to-flow ratio.
The model, used to calculate the stock-to-flow of assets with hard caps, was popularised by the prominent Bitcoin analyst PlanB.
Today, I’d like to cover two additional price models which may shed additional light on the future price of Bitcoin.
Please remember that my only goal is to explain these models to help you understand them, not to make future price predictions.
Random ‘black swan’ events can happen at any time and cause major price movements.
A great example is the impact of Mt Gox on BTC price during 2014 and 2015. It completely shattered the market, causing price to drop for a good two years due to close to 90% of all BTC in circulation being lost.
Could a price model have predicted such an event? Definitely not.
Still, the three models I discuss below have so far stood the hardest tests any model can face: time and black-swan events. The three models are:


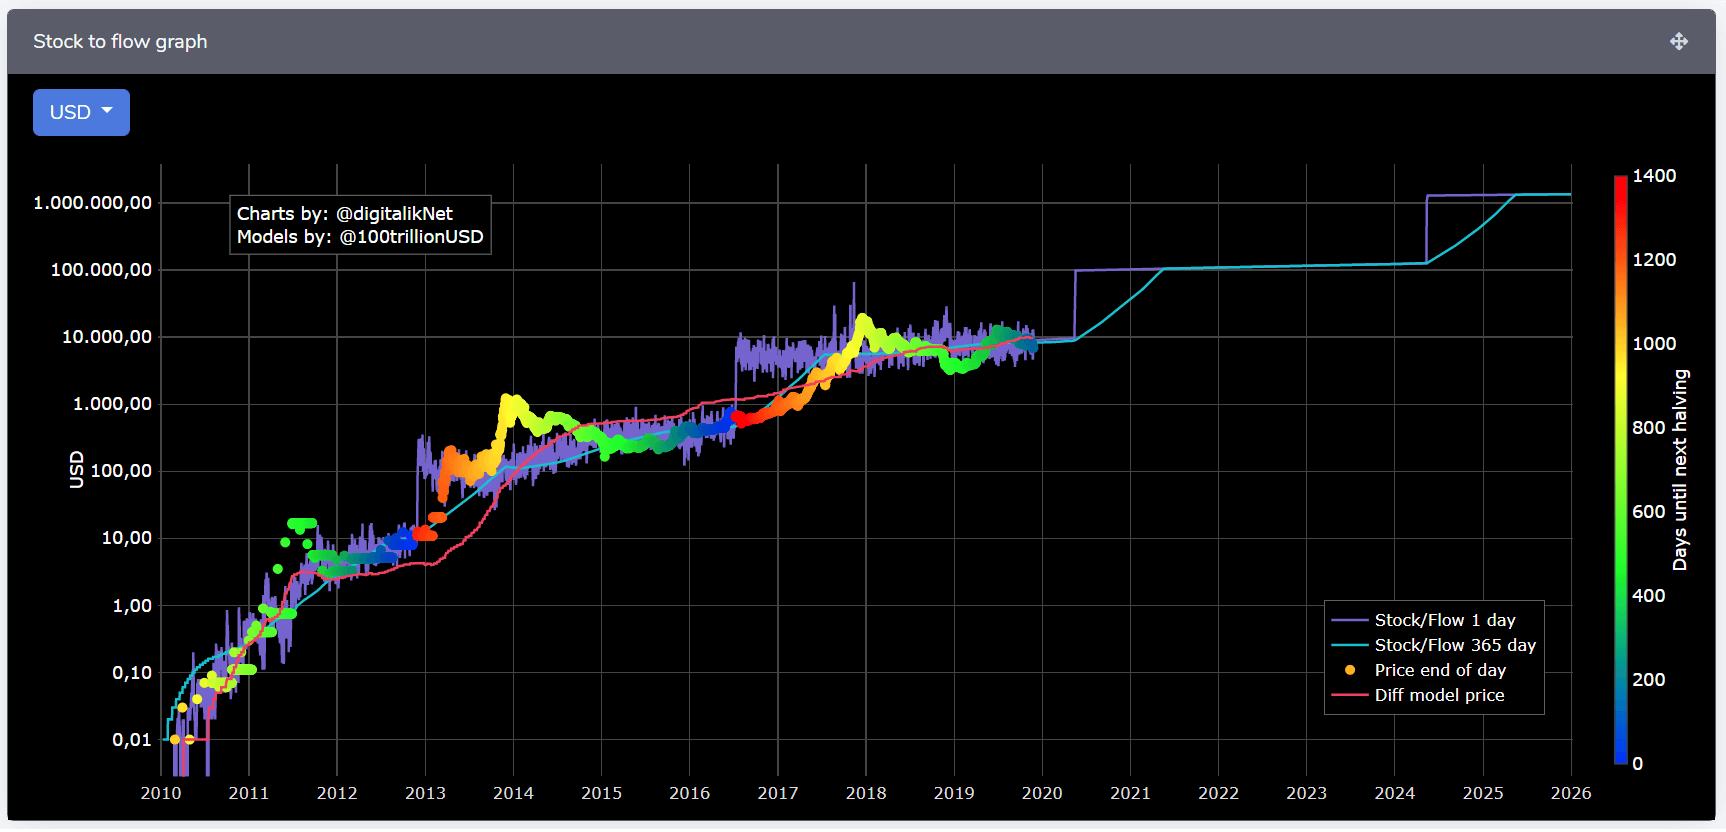
In essence, in the stock-to-flow model shown above (courtesy of digitalik.net), the stock is the size of the existing reserves of an asset and the flow is the yearly production.
Looking at Bitcoin, the stock is the number of circulating Bitcoins – at the time of writing, this is close to 18,000,000 – while the flow is the number of Bitcoins produced in a year, which currently amounts to an average of 657,000 BTC per year at the current block reward of 12.5 BTC.
Gold has the highest stock-to-flow ratio with 62, as it would take 62 years of production to reach the current level of gold stock. Silver has a ratio of 22, while Bitcoin is currently at 27. These high stock-to-flow ratios make gold, silver, and Bitcoin monetary goods.
As explained by PlanB:
“A statistically significant relationship between stock-to-flow and market value exists. The likelihood that the relationship between stock-to-flow and market value is caused by chance is close to zero.”
According to the model:
The Mayor Multiple model was created and popularised by early Bitcoin adopter and hedge fund manager Trace Mayer.
The model supposedly helps predict the best times to buy or sell Bitcoin. It shows the current price of Bitcoin divided by its 200 daily exponential moving average (EMA).
The average Mayer Multiple since the creation of Bitcoin is 1.39. At the time of writing, it is about 0.73.
According to the simulations performed by Trace Mayer, the best long-term results were achieved by accumulating Bitcoin whenever the Mayer Multiple was below 2.4.
Since the simulations were based on historical data, they are purely educational and should not be the basis of any financial decision.
One of the lesser known price prediction models is the Bitcoin long-term power-law model.
This model is the first one I’ve found that also looks into time logarithmically. This means that the gap between years diminishes as time goes by.
The image above, courtesy of Coinmonks, is the most important piece of the model, created by investor and engineer Harold Burger.
According to the author:
“Bitcoin’s price evolution can be understood as moving within a corridor which is defined by two power-laws based on time.”
The importance of looking at price logarithmically is to help us better understand when massive moves may occur.
Any price swings close to the present are so large in magnitude compared to the price in the past that past prices seem meaningless.
However, to make sense of a long-term price trend, all past prices should have some importance. This type of analysis is called log-plot.
In addition to the time log view, the author adds some fancy regressions to adjust for future price bands (the green and red areas in the graph above).
The model’s conclusion is as follows:
Never forget: no model is 100% accurate and a great deal of unaccountable factors, such as black swan events, may push price either higher or lower, for longer or shorter periods, than previously expected.
Safe trades!
Disclaimer: The views expressed in this article are the author’s only. This article isn’t financial advice or promotional material; it represents my personal opinion and should not be attributed to Coin Rivet.
Denver, Colorado, 24th February 2025, Chainwire
Denver, Colorado, 20th February 2025, Chainwire
Washington, D.C., 18th February 2025, Chainwire
Dubai, UAE, 27th January 2025, Chainwire
Those who enter the market at this time may be surprised to hear that Bitcoin…
George Town, Grand Cayman, 22nd November 2024, Chainwire