My name’s Dominic Frisby and I wrote, back in 2013-14, what we think was the first book on Bitcoin by a recognized publisher. I’ve been in the space for a while, and I love it.
I’m going to be writing a weekly article for Coin Rivet, taking a technical look at the crypto-currency markets. And this is the first of them…
Let’s start with the grandaddy – Bitcoin.
I’m going to keep this one simple, because it is.
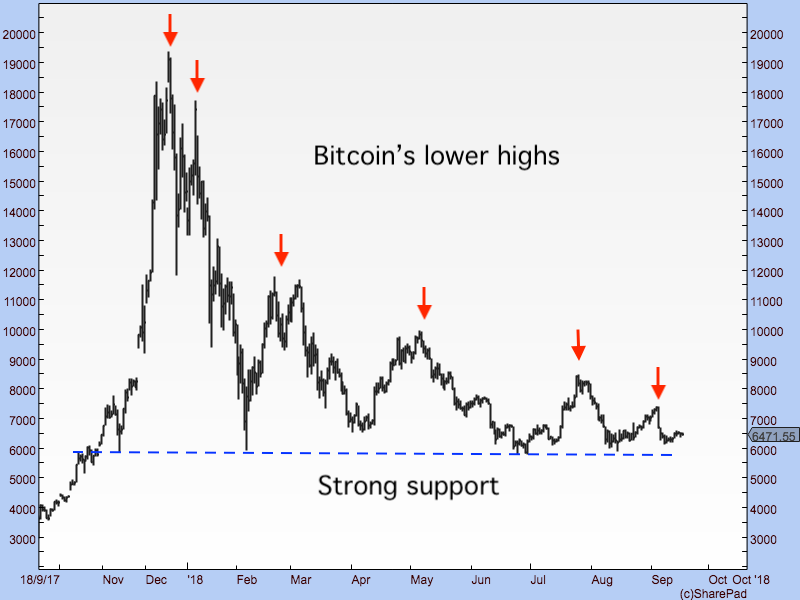
Every high since Bitcoin hit its peak in December 2017 at around $20,000 has been lower than the last (see the red arrows in the chart below). Lower highs are not symptomatic of a bull market. They are symptomatic of a bear market. That is what Bitcoin is in.

However, every sell-off met with strong support in the $5,800-$6,000 area (see blue dashed line). This is a support line that pre-dates Bitcoin’s parabolic move last December. Thus are the most debilitating effects of this bear market mitigated.
We have an enormous triangle forming. I’ve found that, over the years, triangles can be both bullish and bearish. Where they are useful is in managing your risk. Whichever way the price breaks out of the triangle, you can go with – if it breaks above you buy, below you sell. You can then place your stop on the other side of the triangle.
The momentum indicators such as RSI and MACD are not telling us anything. They are so flat that I did not even bother including them in the chart above. The same goes for the medium-term moving averages.
This is a market that is range-trading. The range is narrowing and it won’t be long before Bitcoin has to decide which way it is going to go, or whether (most likely in my view) it is going to continue in this range-bound consolidation.
$5,900 is the line in the sand. Below that and a lot of stops are going to get triggered.
Ethereum
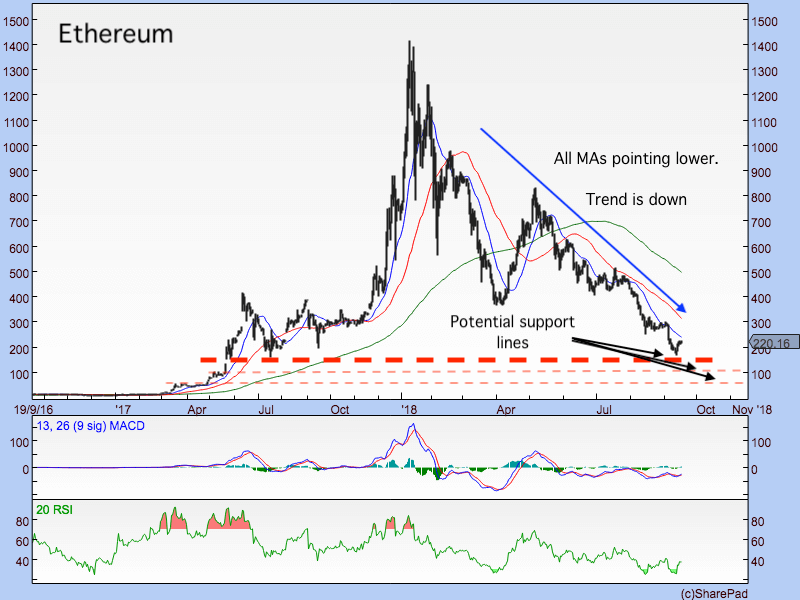
The story is rather different with Bitcoin’s sister, Ethereum. Just like Bitcoin, each high has been lower than the last. What Ethereum hasn’t had, however, is the line of support that Bitcoin has had. So the price has ground lower. Each low has been lower than the last.
I’ve used a two-year chart here so as to show the source of the support lines.

This is what a bear market looks like. The trend is down.
I’ve drawn three simple moving averages (MAs) representing three different time frames – 21 days (blue line), 55 days (red line) and 200 days (green line). They are all sloping down. On pretty much any time frame you care to look at, this is a downtrend. MACD hasn’t been able to get above the zero line since May and RSI is equally mired in the bear market zone.
We are overdue a relief rally, and that’s what we seem to be getting. Interestingly, it came off a horizontal line of support from July 2017 (tick red dotted line), before Ether’s parabolic rise. That is good.
But if the $150-160 area doesn’t hold, we are going to get back to $100 fairly quick. If that doesn’t hold we’ll be back at spring 2017 levels in the $50 area.
Talking to some of my buddies who run exchanges, what has been happening to Ether is that those who used it to raise money in the ICO boom are now rushing to cash out while they still have some capital. The relative lack of new ICOs has meant there are no buyers to step in and take up the slack.
This relief rally could take us back to the 55DMA at around $300. I also have $360 and $415 as possibilities, as well as a test of the 200DMA (green line). But if we get that high, I wouldn’t hang around too long – or at least raise your stops.
Ripple
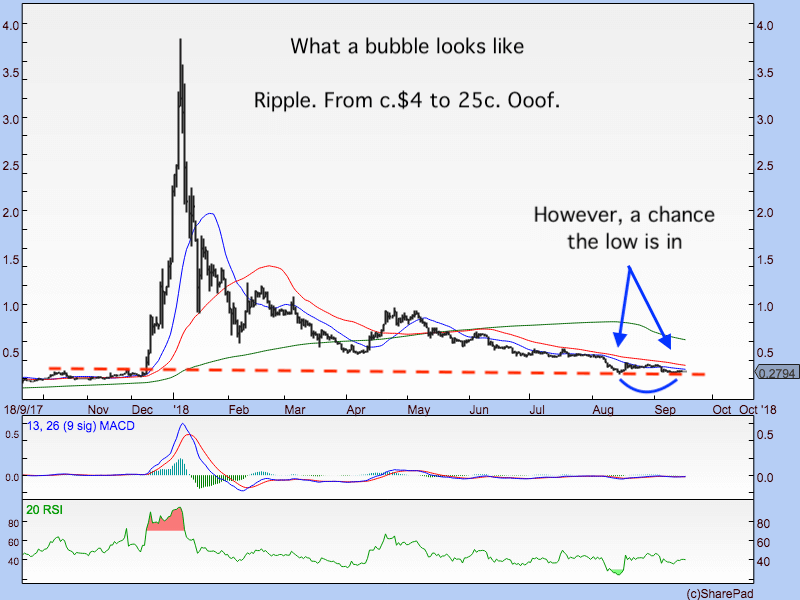
So, to a coin I cannot see the point of – Ripple. This one went from 24c to nearly $4 last December on what was, basically, a rumour. It has since spent the past 10 months coming back down again. Despite the loss of value it remains the third biggest coin by market cap at around $11bn. That’s an extraordinary amount of money.

As with Ethereum, the moving averages are pointing lower, MACD is in negative territory, RSI has left room for another sell-off, the trend is down. The one positive I can draw is that Ripple may just have made a double bottom around the 25c area. There, or just below, is your line in the sand, should you want to buy.
There simply isn’t room this week to post charts of all the other altcoins. I’ll do that next week. The broad trend is the same as Ethereum and Ripple. Where Bitcoin has found support, the altcoins are grinding lower, whether it’s Bitcoin Cash (the coin about which, if you say positive things, you risk being excommunicated from cryptocurrencies altogether), Litecoin, EOS, TRON, Monero, Dash or Zcash.
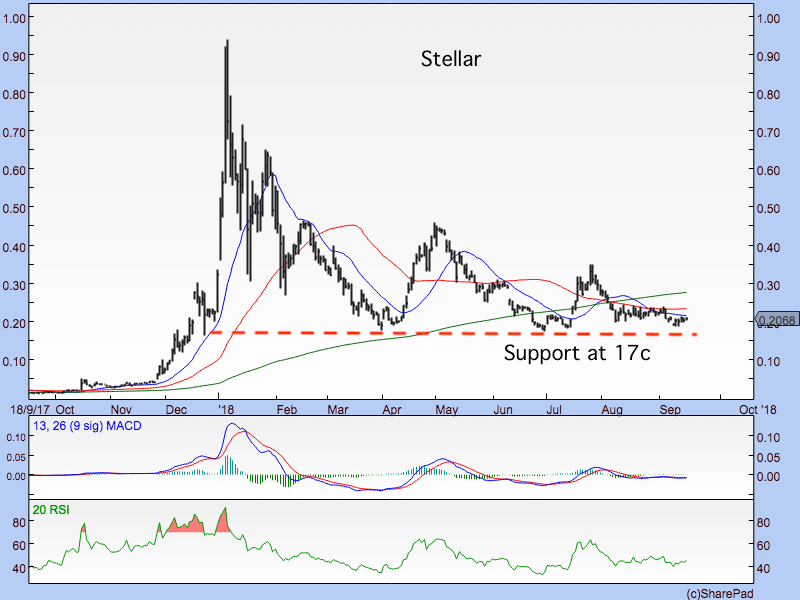
The one beacon of hope is Stellar, the price action of which more closely resembles Bitcoin. Its moving averages worry me the way they are converging with the price below. If it can’t get above them, that is bearish. However, the fact that it has found support around 17c (red dotted line) is positive.

Bottom line, folks, is if you own coins, make sure you have your risk managed. This bear market has further to go. Be honest with yourself: does the coin you own have a unique function or purpose, which makes it special and for which it will actually get used?
If not, it’s going back to its intrinsic value, which is somewhere just above the zero mark.
Disclaimer: The views and opinions expressed by the author should not be considered as financial advice. We do not give advice on financial products.
