Coin Rivet investigates Bitcoin’s on-chain analytics in an effort to illuminate the asset’s ongoing price ranging.
Are we in a period of Bitcoin (BTC) accumulation?
Our launchpad for on-chain analytics is the percentage balance of BTC on all exchanges – a metric deployable to gain insight into present market behaviour and sentiment.
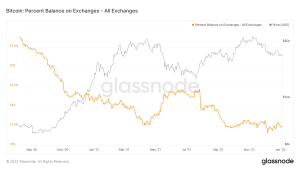
BTC All Exchange Balance Source.
A look at the chart reveals that the number of Bitcoins circulating on crypto exchanges has declined since the onset of 2022 – a continuation of a larger trend of user’s exchange wallets continually depleting as the price of BTC increases.
Sell pressure has dropped off since August, and this trend appears to be carrying into the New Year as the percentage of coins on exchange has declined -0.043% in the first four days of 2022.
This amounts to 9,231 BTC pulled from exchanges globally in 2022 – valued today at $472.5m.
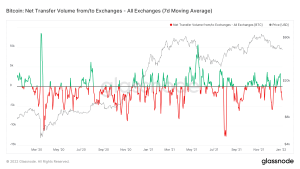
Net Transfer Volume from/to Exchanges source.
A glance at the Net Transfer Volume from/to Exchanges cements the view that there has been a strong outflow of BTC from exchange wallets so far this year – further indicative of accumulation by investors.
With exchange balances safely away from the peak seen in the May dump, it appears market sentiment hasn’t switched to bearish panic just yet – despite the low-ranging price action.
Together, this evidentially suggests the market is in a state of accumulation, although exchange balance data should be taken with a pinch of salt, due to the proclivity for institutional trading to take place OTC and retail’s 10-minute transaction time from ledger to exchange. Things can change quickly.
Bitcoin supply-dynamics: cold and illiquid
Hitting a massive milestone for Bitcoin on January 4, the illiquid supply of BTC (tied up in custodial wallets or cold storage) pushed to a jaw-dropping 76% – leaving only 24% of Bitcoin actively trading in the markets.
The transition of coins from the market to the ledger is an important one, that is slowly applying significant pressure on the supply-side dynamics as more market participants trade about fewer coins.
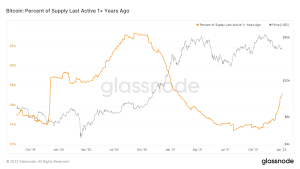
Percent of Supply Last Active 1+ Years Ago source.
Glancing at the percent of supply last active more than a year ago, we can see a continuation of the up-trend for inactive coins carrying across from the latter-half of 2021.
This signals two things – first, that diamond-handed survivors of the class of ’21 are reaching wallet maturity and continuing to hold.
Secondly, the number of inactive coins is nowhere near where it was at the onset of the bull run – although overall between January 4 2021 and January 4 2022 there has only be a -1.156% decrease in the number of inactive coins.
Supply, therefore, seems to be pushing towards accumulative sentiment – as it becomes increasingly cold-stored and illiquid.
Where is BTC sell pressure coming from?
The iconic HODL waves chart is a masterpiece of data visualisation illuminating the varying market actions of different generations of Bitcoin investors.
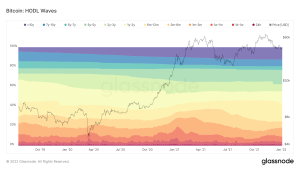
The chart shows the majority of Nov-Dec sell-pressure came from two to three year holds (investors no doubt scarred by 2017), alongside one week to one month holds (likely big spot trades and paper-handed top-buyers).
Bullishly, the chart also shows that there has been significant maturity and growth for three to five year holds. This indicates that long-term holders are unmoved by current market conditions and continue to bide time.
Small recent growth among one to three month holds has also increased, indicating that a potential accumulation period and emergence of new wallets took place throughout the most recent ATH trend.
Has Bitcoin (BTC) hit the top of this bull run?
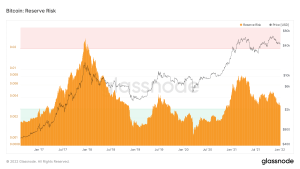
BTC Reserve Risk source. (model created by Hans Hauge)
The reserve risk chart is in effect a measure of confidence in the underlying risk/reward structure of the price action – the lower the reserve risk, the more attractive the risk/reward ratio.
The reverse risk measure trend remains continually sloping down into 2022 – far away from the unattractive tops of 2013 and 2017.
This reinforces the idea of an ongoing accumulation period and would suggest the capacity remains for another bull rally.
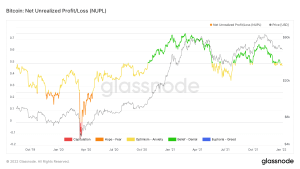
Net Unrealised Profit/Loss (NUPL) Source.
NUPL conceptualises the profit sat on the table – a calculation of the difference between market cap and realised market cap.
Bitcoin is currently at 0.47 (supposed feelings of optimism vs anxiety in the market), a range that has signalled bullish trends since the depths of capitulation in 2018.
While the recent decline indicates profit being taken – likely a mixture of top-buyers and 2017 survivors – it has been limited in extent, especially when compared to the depths of altcoins such as DOT (NUPL: 0.15) and LTC (NUPL: 0.1).
Indeed, Bitcoin is yet to reach the past NUPL top signals from 2013 and 2017 (around NUPL 0.75) – adding weight to suggest this run has yet to reach its full potential.
So what’s the takeaway?
Constructive on-chain data and supply dynamics, while bullish, conflict with the technical face of bearish price action and high open interest – a well-established signal for downward moves. But it seems that some long-term holders are utilising the current corrective ranging as valuable accumulation time with on-chain data suggesting this bull-run is not over yet.
But, if 2021 taught us anything, it was to expect the unexpected, and expect it to happen fast.
Read more: Latest Bitcoin Technical Price Analysis (Jan 5)
Disclaimer: The views and opinions expressed by the author should not be considered as financial advice. We do not give advice on financial products.
