At the time of writing most of the cryptocurrency market is in the green. Some notable coins such as Cardano (ADA) have risen 20% in the last 24 hours.
Interestingly, Bitcoin (BTC) managed to hold support at $45,000 whilst also breaching $46,000 momentarily.
The Graph (GRT) is currently trading at a price of $0.7786, rising 4.84% over the last 24 hours. Its daily trading volume rests at $210M, and it ranks at number 34 on CoinMarketCap. GRTs total market cap lies at $3.673B.
The Graph recent price action
Over the last 48 hours, GRT has risen from a low of $0.64 to recent highs of $0.78. A rise of just over 21%. It successfully broke short term resistance near $0.70 before touching it as support and then rising to its recent high.
It is now approaching resistance near $0.80, which has previously shown to be a crucial level for the coin.
To further aid the bullish bias is the Moving Averages (MAs). The 50 period MA, is once again above the longer 200 period MA which indicates the market is overall bullish.
It should be noted that it would require a significant increase in volume to breach the $0.80 resistance, which is still yet to come.
As of the time of writing, volume is starting to decrease which indicates that a shorter-term reversal could be imminent.
GRT/USD 4-hour chart: Short term reversal
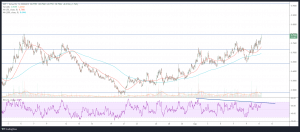
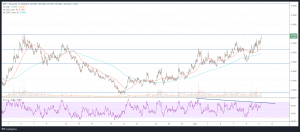
On the 4-hour chart, the overall outlook for GRT is bullish. The coin has recovered well from a low of $0.47 cents to make up for the losses when it previously rejected resistance at $0.80. Furthermore, the cryptocurrency appears to be making a cup and handle formation.
However, the handle is yet to be completed, and a small retracement can be expected in the short term. To further aid this theory, is the bearish divergence that is showing on the RSI indicator.
On the chart, the price is making higher highs, but the indicator is making lower highs. Normally this signifies that buyers in the market are losing momentum and the sellers are taking over.
Combined with the fact that resistance at $0.80 has previously proven to be a key area, it can be expected that GRT will reject this area, to retest previous support levels at $0.75 and $0.70 respectively.
Conclusion
Overall, the shorter-term outlook for the coin is bearish, but the longer-term outlook remains bullish. A rejection of resistance at $0.80 can be expected with the price falling to retest the $0.75 or $0.70 supports respectively.
It is also important to note that like other altcoins, GRT follows BTCs movement. Therefore, if BTC starts to violently drop in price, these support levels are unlikely to hold for GRT.
However, if these support levels do hold, then GRT will be forming a perfectly shaped cup and handle pattern. Combined with enough volume, the coin can be expected to violently break the $0.80 resistance.
Disclaimer: The views and opinions expressed by the author should not be considered as financial advice. We do not give advice on financial products.


