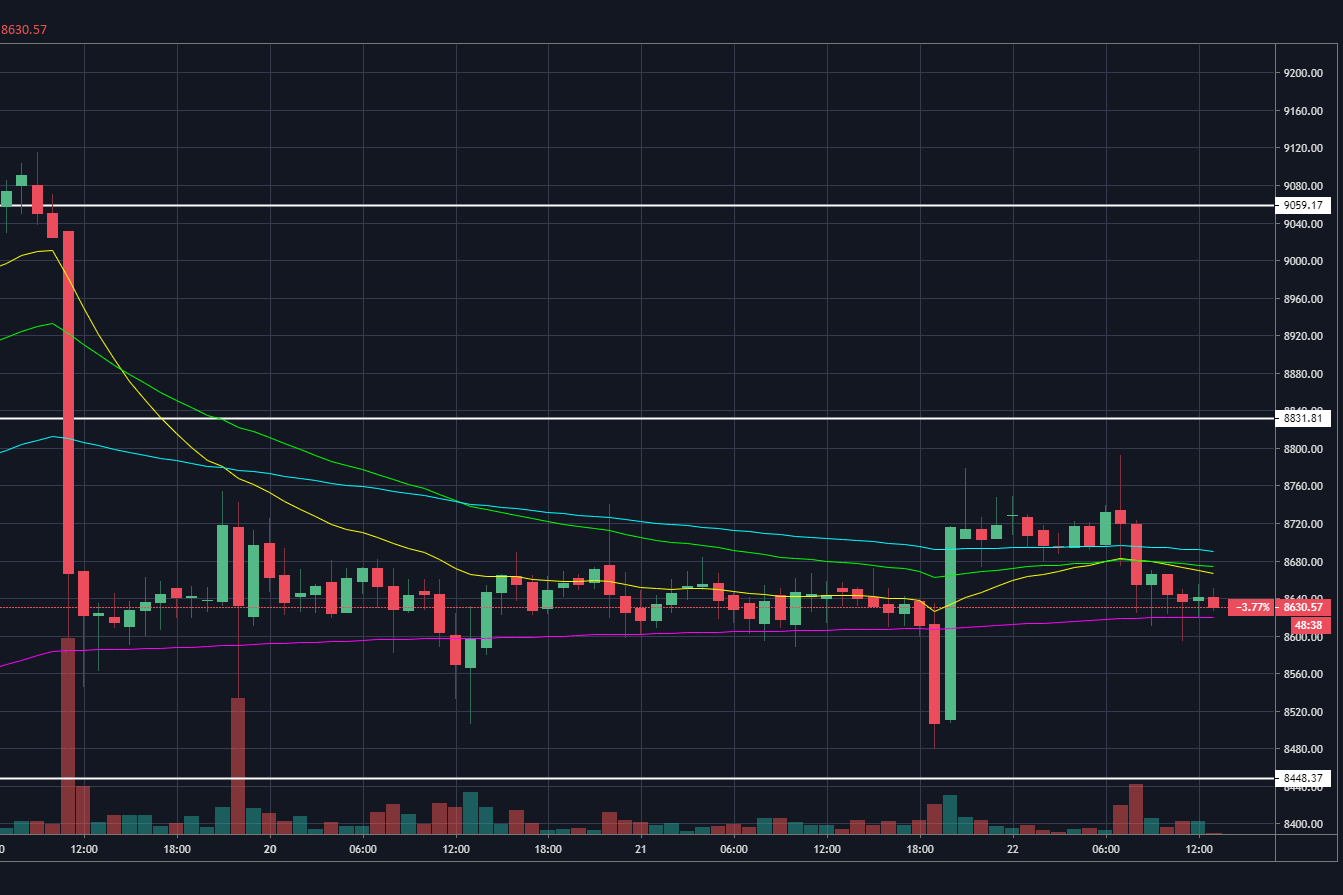

Bitcoin has now been trading in a sideways pattern for the past three days following last weekend’s wildly volatile price swings.
On January 19, Bitcoin momentarily traded above $9,000 before a staggering 8% decline in a one-minute candle.
The slump ended with Bitcoin bouncing at the $8,400 level of support, which was a previous point of resistance on January 8.
Since then, the world’s largest cryptocurrency has stabilised in the $8,650 region, with price seemingly being pegged to the 50 exponential moving average (EMA) on the four-hour chart.
It’s also worth noting that the current price point also marked November’s infamous death cross, which saw the daily 50 EMA cross the 200 EMA to the downside.

The 50 EMA is now interestingly ticking back up towards the 200 EMA, which means a golden cross could come to fruition in the coming weeks to provide more pressure to the upside.
The initial levels of resistance to look out for on the Bitcoin chart are at $8,830 and $9,050. A break above either of these levels will almost certainly see volatility return to the market as the block reward halving edges closer.
As previously reported by Coin Rivet, previous halvings have always preceded Bitcoin forming a new all-time high within the space of a year, as miners are incentivised to increase the price in order for the industry to stay profitable.
For more news, guides, and cryptocurrency analysis, click here.
Denver, Colorado, 24th February 2025, Chainwire
Denver, Colorado, 20th February 2025, Chainwire
Washington, D.C., 18th February 2025, Chainwire
Dubai, UAE, 27th January 2025, Chainwire
Those who enter the market at this time may be surprised to hear that Bitcoin…
George Town, Grand Cayman, 22nd November 2024, Chainwire