It’s like someone hit the pause button across the entire sector. It’s not often I’ve been able to say this, if ever, but: there was more going on in the fiat forex markets this week than there was in crypto.
For a sector associated with as volatile action as crypto, these last few weeks have been extremely unusual, because of the very lack of action. Crypto has been flat, flat, flat.
There are two ways you can read this, depending on your narrative. You can see it as a positive. The relentless selling has abated. In volatile assets flat action often precedes big moves. These markets are “building cause” as the technical analyst Tom O’Brien used to say. The selling has stopped. When the buyers come in, that will push prices higher.
On the other hand you can see it as a negative. This is just a pause before the next leg lower.
I must say, looking at the charts I can find evidence for both arguments. So let’s have a skim through and see what we can garner.
Bitcoin…
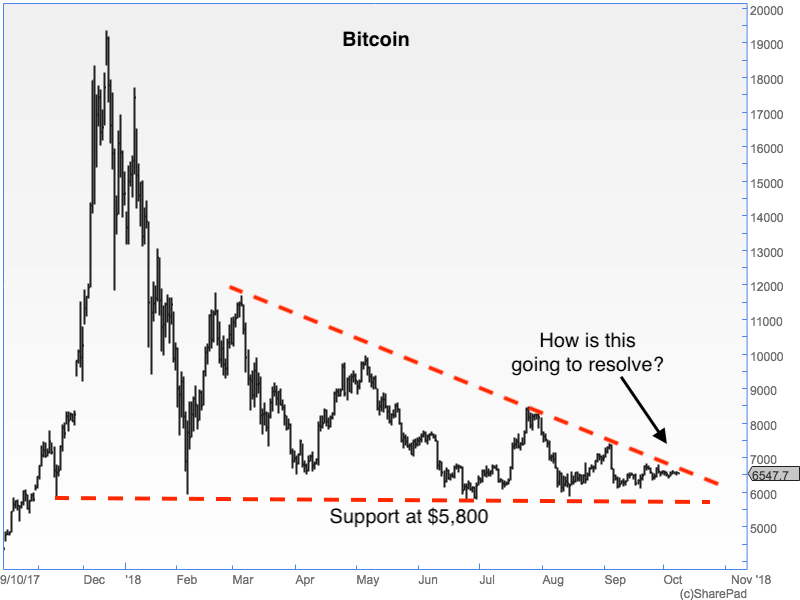
Let’s start with Bitcoin. It’s by far and away the largest coin by market cap, and, for the general health of the market, we need it to hold up. $5,800 is the line in the sand. That line continues to hold.
Here’s the multi-month triangular pattern that has built over this year. The range is getting narrower and narrower, however, and soon, perhaps within the next fortnight, it is going to resolve. The question is how.
As long as Bitcoin does not break below that horizontal dashed red line at $5,800, the sector will be fine. If $5,800 fails, there is likely a multitude of stops just below and that could trigger an avalanche.
Ethereum
Next let’s turn our head to Ethereum, number two by market cap. Having benefited from the ICO craze in 2017, when everybody bought Ethereum to get in on their ICO, so did it suffer in reverse in 2018, as ICOs liquidated their Ethereum to protect capital.
From its high of $1,420 at the beginning of the year to its low of $163 it lost around 89% of its value. It’s pretty grim stuff. If you want to get an idea how your ICO is doing – there’s your proxy.
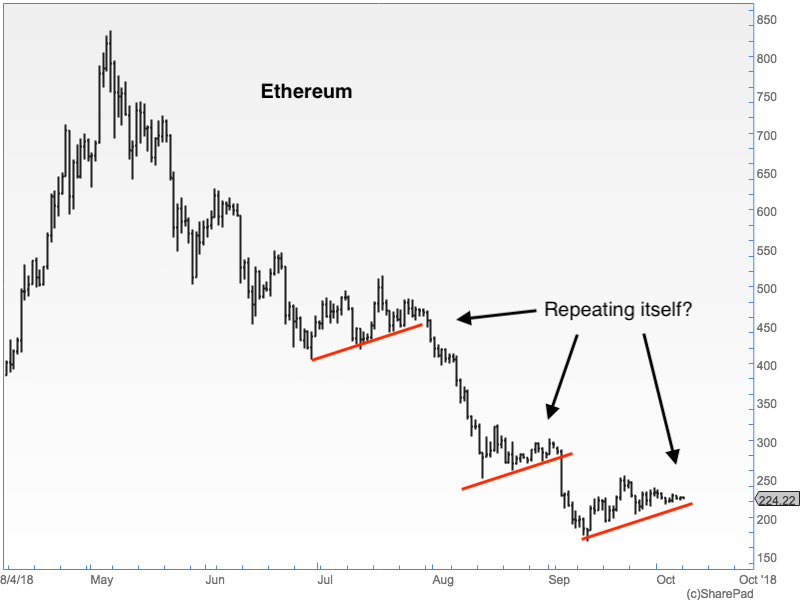
Today we’re at $224 – about 85% off the highs – and things have stabilised. I must say, I remain concerned about Ethereum, even at these low levels. That’s for the simple reason that Ethereum has previous. I don’t entirely trust this stabilisation.
Here’s the chart. You can see the red lines I have drawn on previous occasions where Ethereum gave the impression of bottoming out.
The question you must ask yourself is: is this recent action, just another repeat of July and August? Or is it third time lucky?
Ripple, at 48c, also looks to me like it might want to go lower, but it’s still in the range we mapped out last week, so let’s move on to some of the other coins.
Privacy is everything
Let’s look today at some of the privacy coins, and we’ll start with the most famous – Monero.
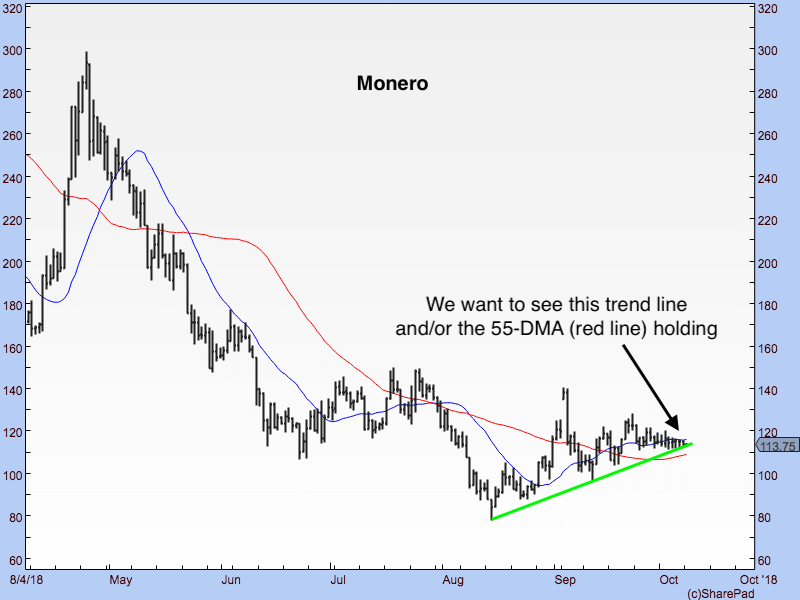
Monero, like Ethereum, has established a nice uptrend since its August low. From $80 to its current price of $113.
Like Ethereum, it did something similar in June-July before falling off a cliff in August, and I am concerned it is about to do something similar now.
Dominic Frisby’s crypto focus October 8 2018 – Monero
It is sitting on support (green trend line) now. We want that trend line, or the 55-day moving average 9-red line) just below to hold. There’s a trade here to be had, placing your risk just below the 55 DMA. As long as, say, $100, holds I’ll give it the benefit of the doubt.
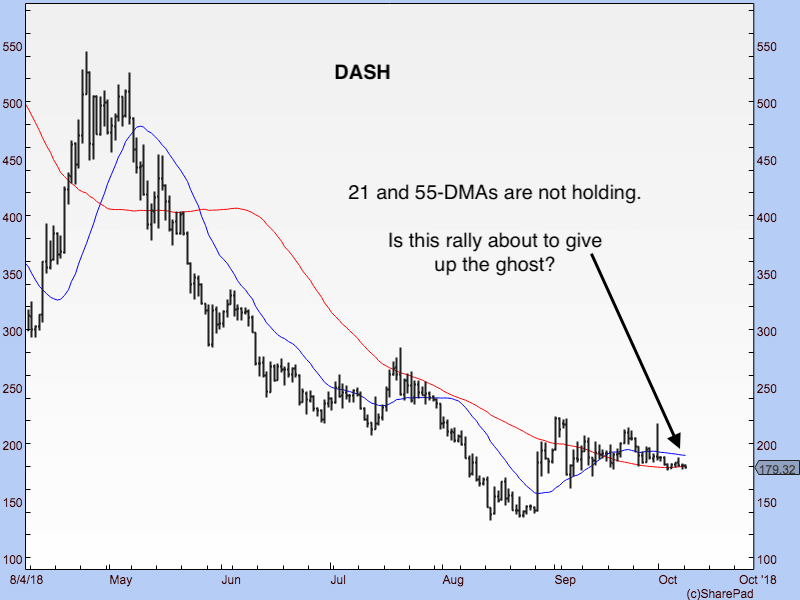
Dash looks a little weaker. Having enjoyed the same rally as everyone else, it now looks in danger of rolling over as it slips below its 21- (blue line) and 55- (red line) DMAs.
Dominic Frisby’s crypto focus October 8 2018 – Dash
Zcash, for all its qualities, looks weaker still. Its September rally has faded. It never even got as high as its 55-DMA (red line). And now it is slipping below its 21-DMA (blue line). The downward trend is set to resume if it can’t hold above the $118-120 area.
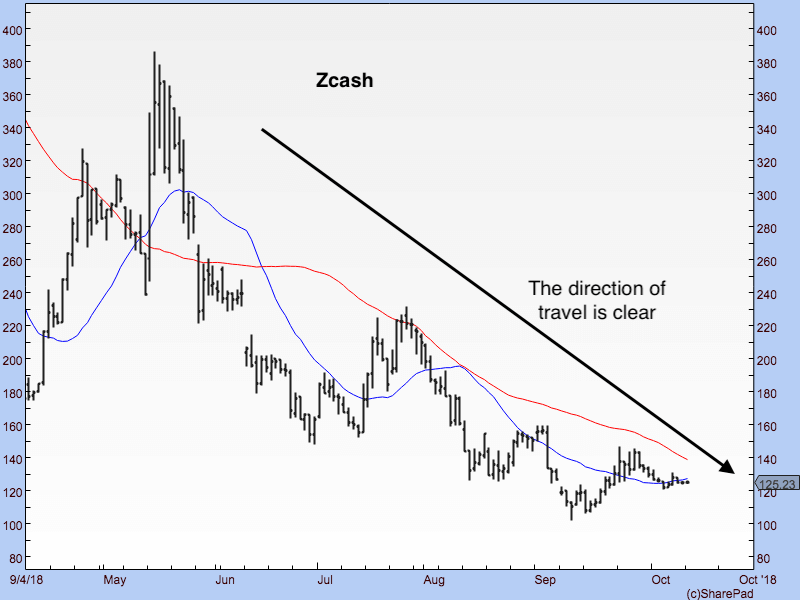
Dominic Frisby’s crypto focus October 8 2018 – Zcash
The coins which are showing us the way
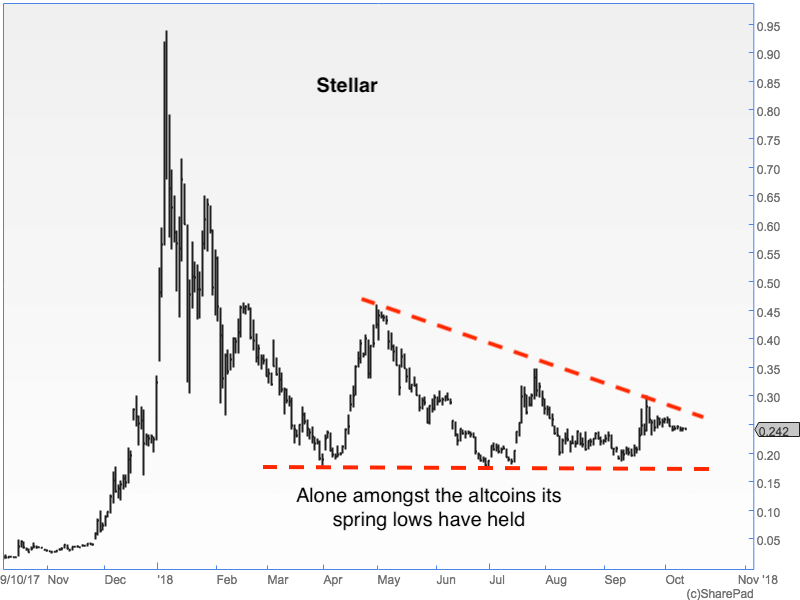
Stellar has impressed me this year for the way that, almost alone among the altcoins, it has not made lower lows in 2018, but held the levels it reached in its March sell-off. The result is a triangular pattern not unlike that of Bitcoin.
Dominic Frisby’s crypto focus October 8 2018 – Stellar
It is currently sitting just above its 55-DMA (not shown on the chart), which is another positive. We want to see 23c holding.
Finally, here is Bitcoin Cash, the coin that is even more divisive than Brexit and Donald Trump put together.
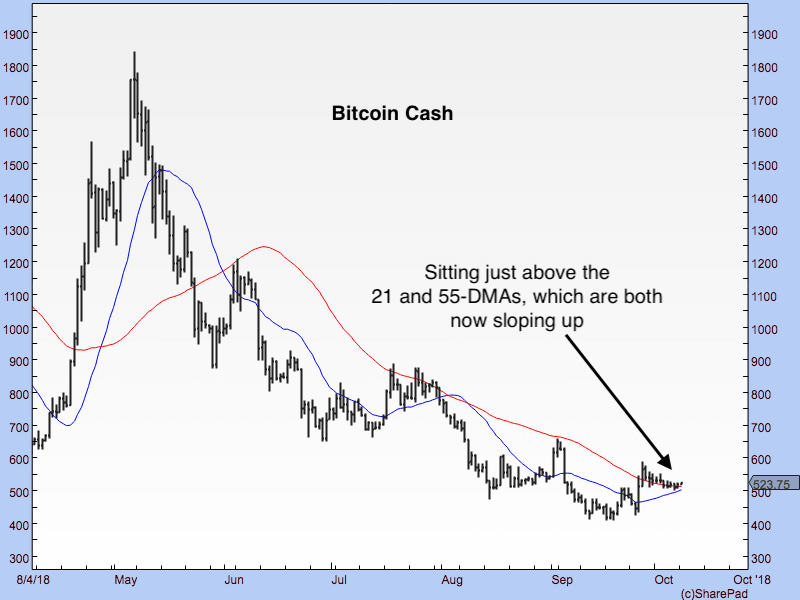
What I like about this chart is that the price is now sitting above the 21- and 55-DMAs, both are sloping up and we are about to get a golden cross (assuming the price holds).
Dominic Frisby’s crypto focus October 8 2018 – Bitcoin Cash
We want to see the $500 area holding.
This is the sort of action I like to see at the beginning of a trend. But before we start sounding the trumpets and banging the drums, the price is still below its early September spike around $650, and indeed its October spike to $600. These are our first targets. Your risk meanwhile can be to just be below those two moving averages.
So, all in all, some interesting divergences in the crypto – straying from the all-one-market patterns of the past. At the moment there are mixed signals, but at least those mixed signals are giving us an idea where to place our risk.
Disclaimer: The views and opinions expressed by the author should not be considered as financial advice. We do not give advice on financial products.

