As the year draws to a close, Bitcoin seems resigned to ending 2019 under the $4,000 mark – a far cry from 2017’s all-time high of $20,000.
While Bitcoin continues to falter, the US stock market experienced its biggest point gain in history on December 26th, with the Dow Jones rallying more than 5% to save itself from a seemingly inevitable bear market.
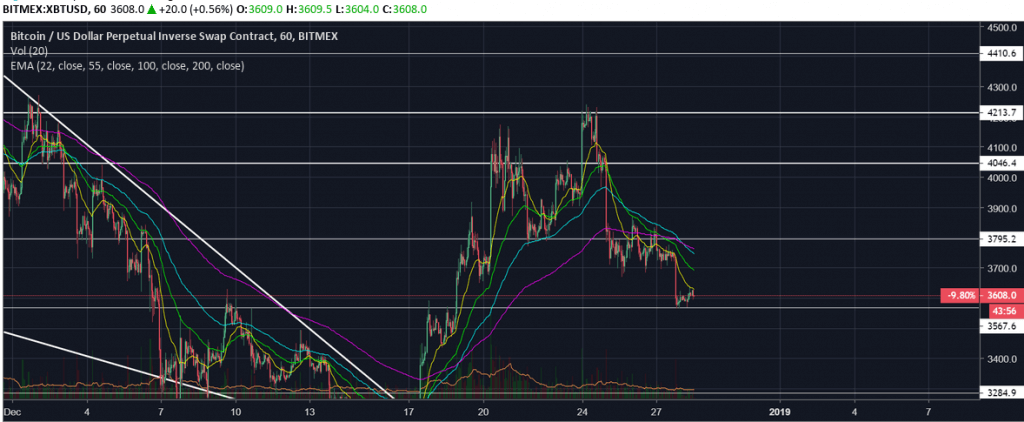
Tech stocks like Amazon saw daily gains in excess of 7% in light of their record-high Christmas sales. Bitcoin, meanwhile, fell beneath the 200 exponential moving hour on the four-hour chart, indicating that the immediate trend is most certainly pointing to the downside.
Correction, inverse head and shoulders, or $1,800?

Bitcoin’s price is currently pegged at around $3,600 as it enters a low-volume period of the year. This level must hold in order to prevent a drop to the next level of support at $3,250.
It’s worth noting that before Bitcoin’s recent lull, the largest cryptocurrency had just rallied over 20%, rising from yearly lows to spike up to $4,250, before falling back to the downside.
The failure to capitalise on the bullish sentiment leading up to Christmas may be seen as a crucial point moving into the New Year. Bitcoin’s rejection at that level suggests that investor confidence is still low, meaning that price could be forced to go lower before buyers step back into the market.
There have been suggestions that Bitcoin is currently completing an inverse head and shoulders pattern, which would be indicative of a bullish reversal. However, the lack of volume around the neckline during the middle of the formation invalidates any form of head and shoulders.
Instead, it looks as though Bitcoin will trickle lower to test the fragile yearly lows. If this support breaks to the downside, the next major level will be around $1,800, which is a price point where Bitcoin bounced over 50% in three days last July.
Is the stock market inversely correlated with Bitcoin?

During 2017’s cryptocurrency bull run, the stock market also saw increased gains, with many suggesting that the two markets rallied in tandem. However, 2018 has been a different story, and while the stock market has continued to extend its rally, cryptocurrency has fallen heavily to the downside.
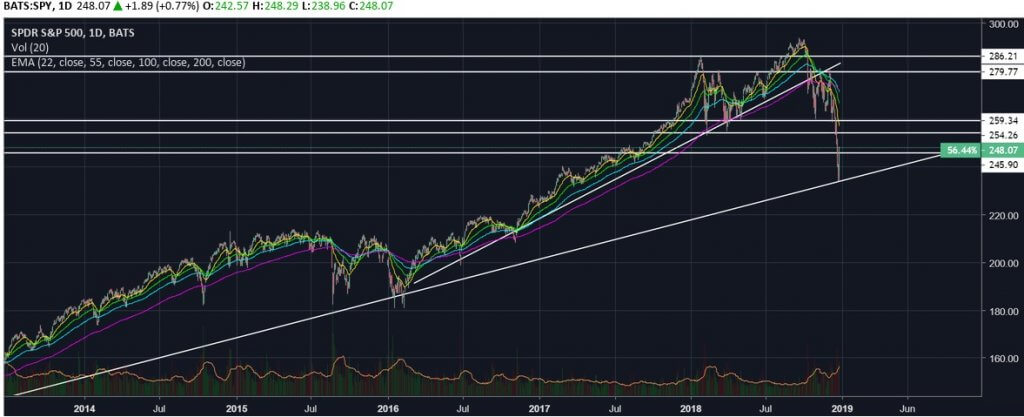
From December 17th to 24th, the S&P 500 and Dow Jones both fell significantly, whereas during this same time, Bitcoin rallied over 20%. On December 26th, the stock market saw its best point gain in history as Bitcoin’s price cascaded downwards.
The stock market is not out of the woods in terms of a bear market just yet, however – the S&P 500 is still 20% lower than at the start of October. This recent rally could just be institutions and funds closing their shorts after price hit a longstanding diagonal support trendline.
What’s in store for 2019?
The coming year will be momentous for both Bitcoin and the stock market. The cryptocurrency markets as a whole will be hoping to cycle back around into a bull phase following a gruelling 12-month bear market. The stock market, meanwhile, will be hoping to save itself from a bear market, which could be driven by trade wars between China and the USA as well as major political events like Brexit.
The stock market has been rallying ever since 2009, and a 10-year bull market will undoubtedly come to an end eventually. On the weekly chart, the S&P 500 was propped up by the 200 exponential moving average, which coincides with the same diagonal trendline that hasn’t broken since 2009. But if it does break, expect traders to enter a panic stage where many of them will be switching to the short side of the trade.
For more cryptocurrency news, price analysis, guides, and more, click here.
Disclaimer: The views and opinions expressed by the author should not be considered as financial advice. We do not give advice on financial products.
